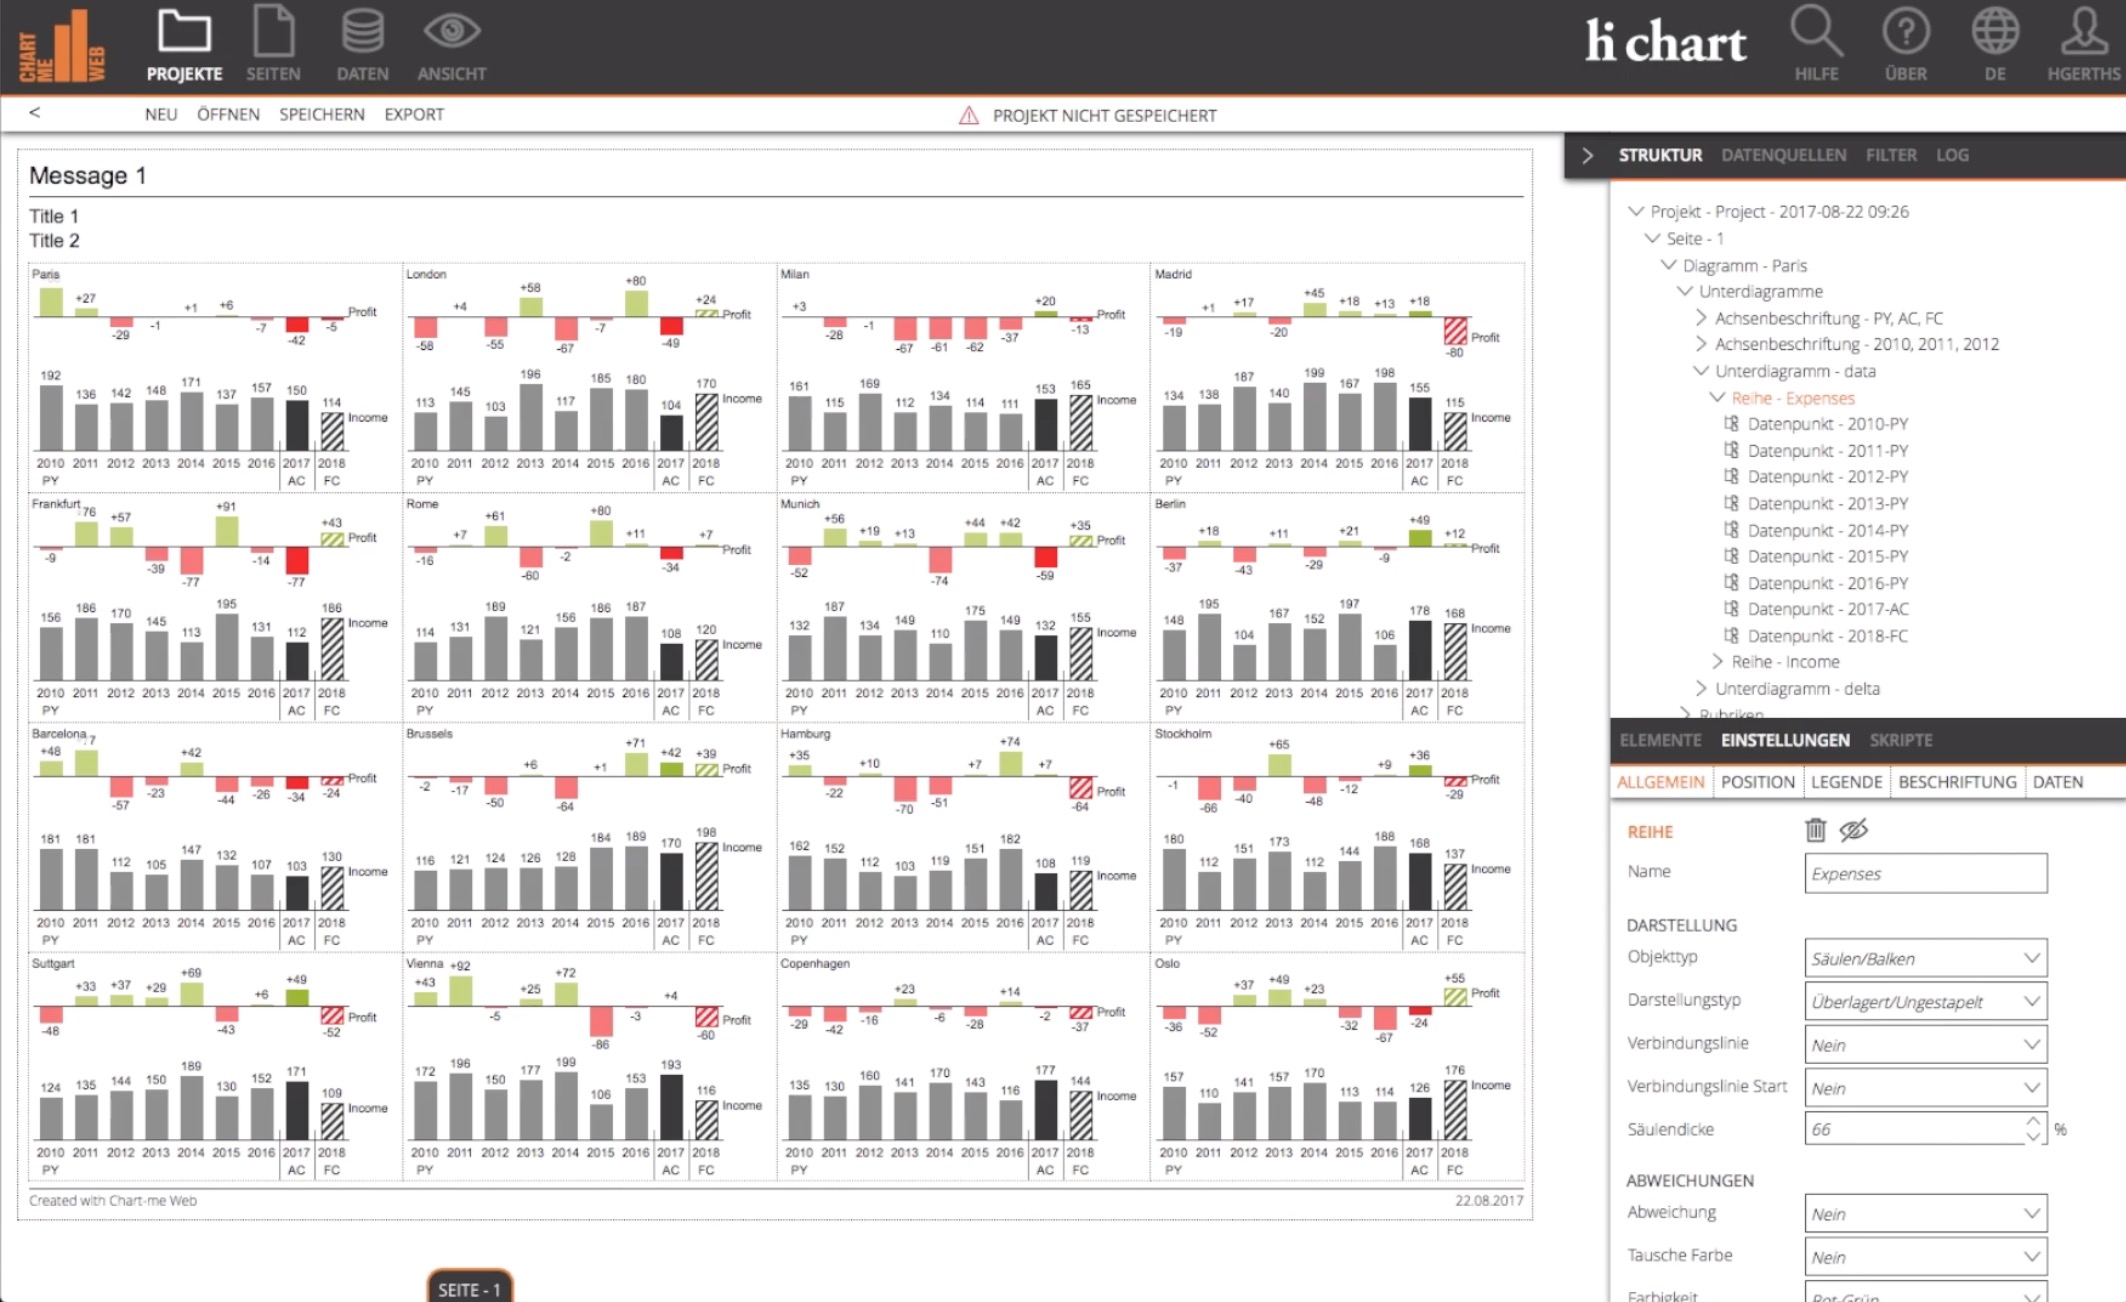
Multicharts can now be created automatically data-driven with Chart-me WEB.
The topic Condense in the SUCCESS model is to put as much information as possible on one page.
Similar to a subway map, which you also want to see on one page, you can quickly see the connections in the system.
In order to do this well, more than two dimensions should be displayed on a two-dimensional screen even when visualizing business figures.
There are some examples in the IBCS chart examples of Hichert + Faisst.
Multicharts are an important way of presenting an additional dimension on a two-dimensional drawing surface. The charts themselves form a new display dimension.
So far, this has been a considerable effort as this is a copy + paste hard work.
And, of course, hard work should be transferred to the software.
We have done this for you.
Here’s how it works:

HI-CHART news, offers and more.
Your email address will not be shared with third parties.


 Twitter
 Xing
Xing YouTube
