Chart-me WEB now provides an interface to Cognos TM1.
Structures and contents of multidimensional cubes can thus be visualized according to the rules of IBCS.
That’s how it works:
Interface to IBM Cognos TM1
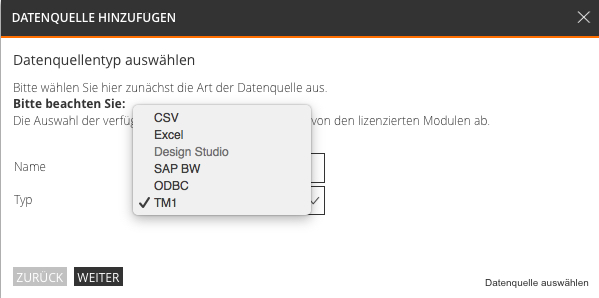
Add a new datasource.
Select as type “TM1”.
Basically, data sources of different types can be combined.
Select a server.
The available servers are set up during the configuration of Chart-me WEB.
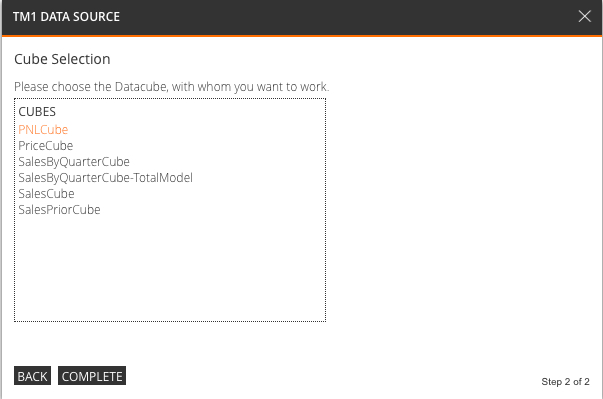
Then you select one of the available cubes
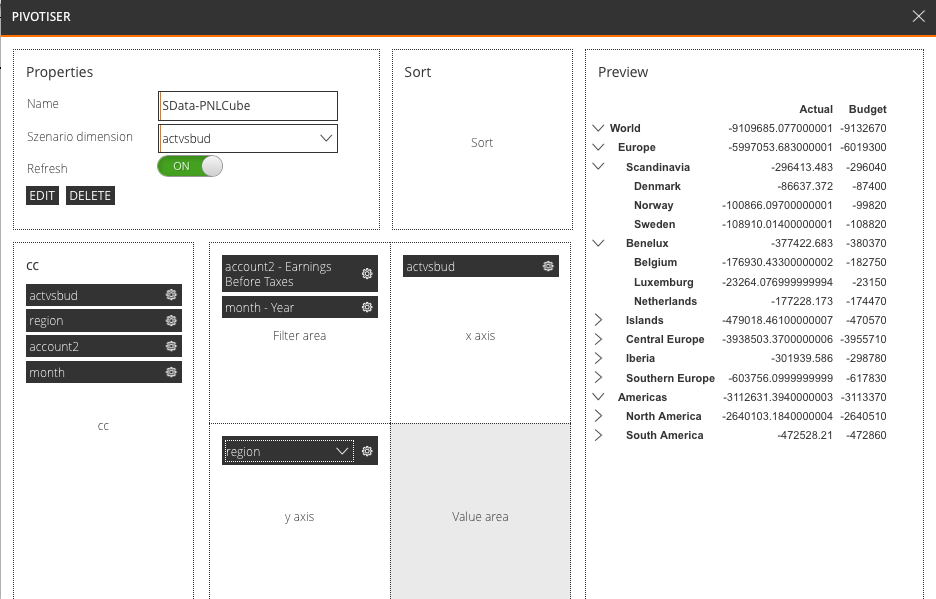
In the pivotizer, the dimensions are sliced and diced according to your needs.
You can also use existing subsets.
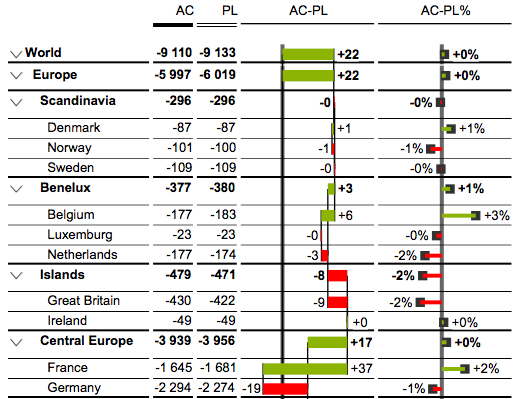
Then a visualization can be created, which is automatically IBCS-conform, and looks great right from the start.
The creation of the shown table with deviation charts takes about one minute.
The design can be adapted to company-specific concepts by the usage of central stylesheets.
The hierarchies can be expanded and collapsed by the user.
Click events can be defined for an interactive user experience.
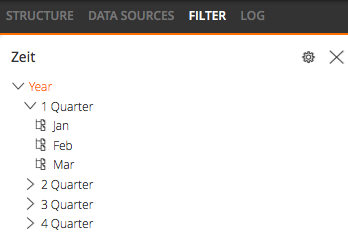
Create filters that are accessible to reading users.
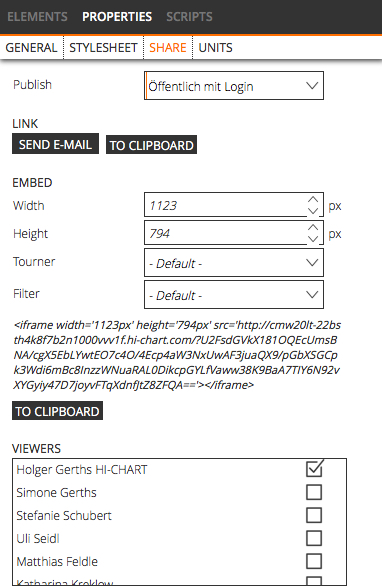
Share project for named users or via email link – or export as a high-resolution PDF
HI-CHART news, offers and more.
Your email address will not be shared with third parties.



 Twitter
 Xing
Xing YouTube
