

hi-chart with IBCS®
Business reports serve to paint a clear and understandable picture of businesses. Managers only have a solid foundation for decision making when business figures can be correctly analysed, put in context and finally, presented in a convincing manner. Particularly during this last stage of reporting – the written and visual presentation of business figures – important information often becomes concealed or is expressed in an ambiguous fashion. Uniform rules of communication are all the more important.

Prof. Dr. Rolf Hichert
For a long time, Prof Dr Rolf Hichert has concerned himself with the question of how business communication can be most successful. Today, the SUCCESS presentation concept together with IBCS® rules counts among the leading methods of ensuring successful business communication.

Focusing on
the essentials
Central to the concept are unambiguous messages, consistent standardization and focusing on the essentials. The SUCCESS concept together with the IBCS® rules bring important advantages to practically all areas of business communication, whether in business reports, presentations or in the everyday exchanges between controllers and decision makers.

The particular importance
of visualizations
Visualisations of business figures have a particular importance for SUCCESS and IBCS®. Visualisations not only help make business data easier to understand than just an Excel table could. When properly implemented, they generate a clear picture of developments, relationships and divergences. Therefore, it is crucial that a visualisation of business figures focuses on the essentials, and that universal, consistent visual language is used.

Tools for successful business management
In this way, is it not only the user value of business graphics that increases considerably. The graphics paint a picture of the business that is inherently consistent and which is unambiguous and easy for everyone to read. Business charts, diagrams and graphs are therefore an essential tool for successful business management. The IBCS® certified products hi-chart, and hi-chart Excel, hi-chart PowerBIhi-chart DS have been developed especially for this purpose.

hi-chart’s visualisation principles
The “International Business Communication Standards” (IBCS®) are proposals for the conceptual, visual and linguistic design of business reports and presentations. The goal is a better understanding of documents in business communication. Even before the definition of these standards, Prof. Dr. Rolf Hichert defined a total of seven rules for successful business communication. The charting principles of hi-chart are based on these rules, the SUCCESS concept.
SUCCESS design rules
Companies that respect the basic principles of SUCCESS ensure the uniform use of terms and signs for easier communication without misunderstandings. They reduce content to the essentials, formulate clear messages and thus create the basis for efficient communication.
The following seven rules are proposed for written business communication (eg reports, statistics) and oral business communication (eg presentations, lectures):

SAY Convey a message
Do you have something to report? Often reports are merely a collection of data with no discernible message for the audience. This is also the case for most presentations.

UNIFY Apply notation standards
Things which mean the same should look the same and things that are different should not look the same. Unambiguous design rules facilitate production and comprehension.

CONDENSE Increase information density
A high level of information density makes it possible to display complex facts. Only an overview of the entire picture permits correct evaluation of detailed information.

CHECK Ensure visual integrity
The recipients of a report expect the data in it to be accurate. But are the correct data also presented accurately? Manipulated charts are a matter of fact in business communication.

EXPRESS Choose proper visualization
Good visualization starts with the selection of those diagrams and tables, which convey the desired message along with the underlying facts as quickly as possible.

SIMPLIFY Avoid clutter
SIMPLIFY facilitates the readability of charts and tables. Eliminating ‘Noise’ and ‘Redundancy’ frees objects in a report from avoidable background noise.

STRUCTURE Organize content
Reports and presentations have, in many cases, no logical structure. When things overlap and are incomplete, they make it hard to understand business communication.
IBCS® – Better understand reports, presentations and dashboards
Video 2 minutes


Solution examples
Matching chart examples for typical business management tasks

When planning a management report, the question arises again and again: How do I present my figures in such a way that relationships are quickly to recognize and crystal- clear for the reader? As a table or chart? Or as a combination of both? Columns, bars or scatter-charts? The SUCCESS model with the IBCS® standards provides conceptual design guidelines. Since pictures say more than a thousand words, there is a prepared collection of typical images for ever-recurring business-related tasks.
All solution examples were created with hi-chart!
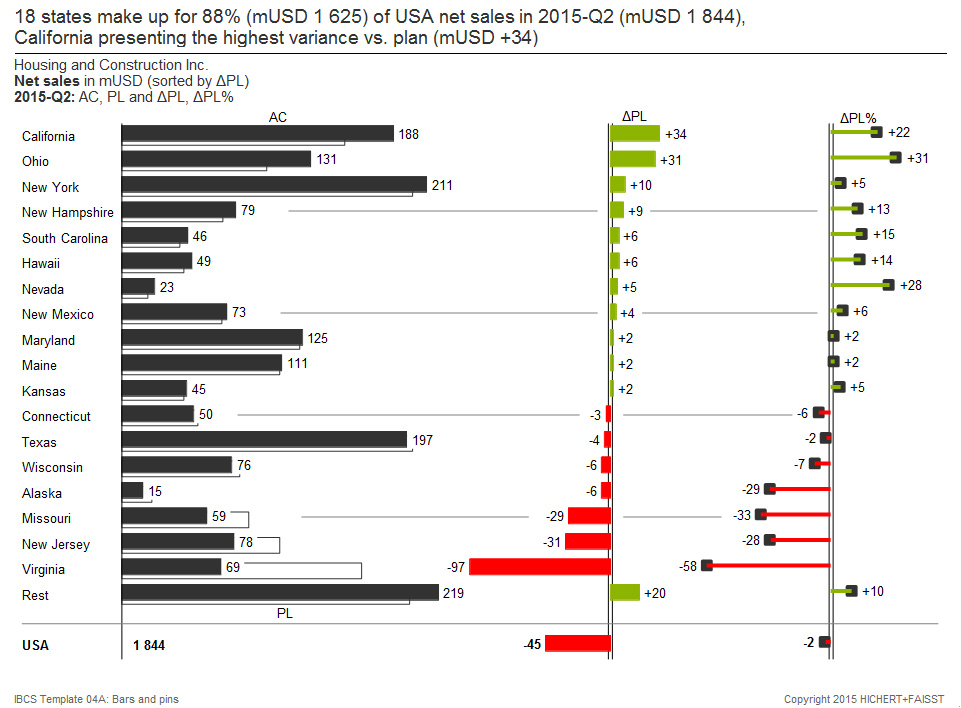
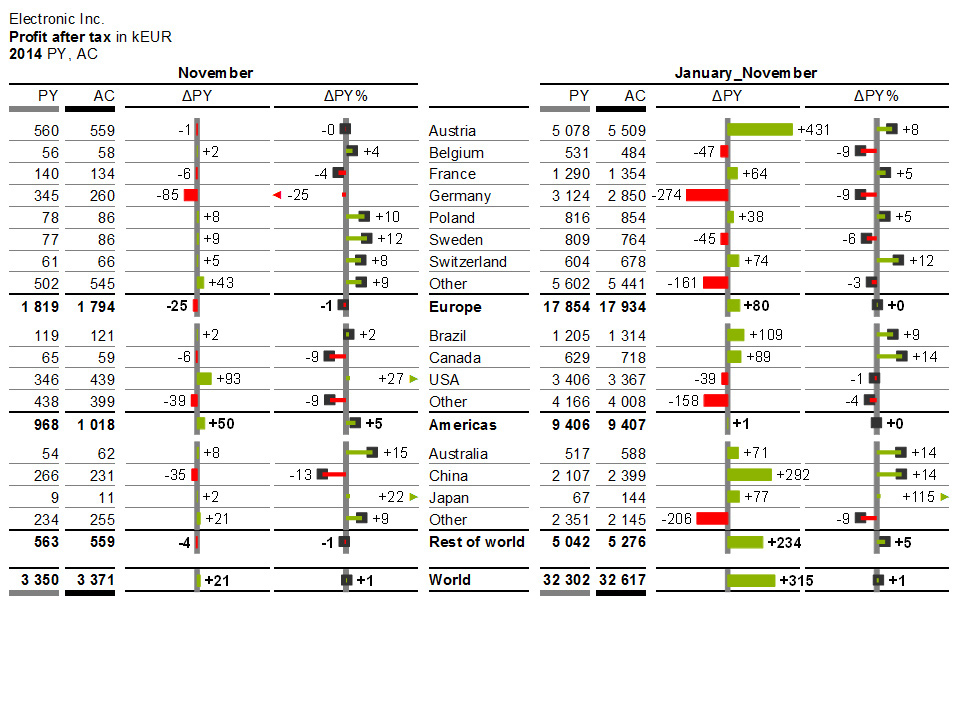
Multi tier column and bar charts
In multi tier column or bar charts, the first tier compares different scenarios in a grouped column or bar chart. The second and third tier show different absolute and relative variance charts.
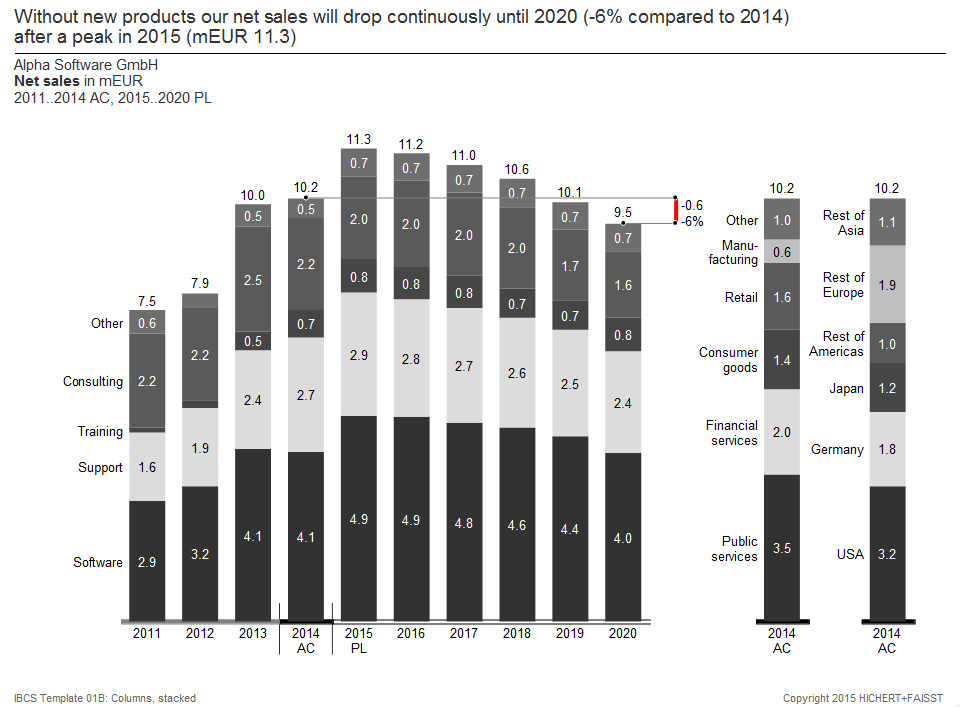
Stacked column and bar charts
Stacked columns and bar charts are used for many analyzes in practice for the display of data in their temporal development or in a given period of time or at a particular moment.

Columns and bars with waterfall charts and vertical waterfalls
Waterfall charts are used to visualize the summation of values along a dimension. If accumulated over time, it’s called cumulation. However, it can also be summed up using a P & L or a contribution margin structure.
read more
Vertical waterfalls are used, for example, for a P & L statement. On the left, this figure shows two vertical waterfalls and on the right two further tiers show the absolute and relative variance of these two waterfall charts.
read more
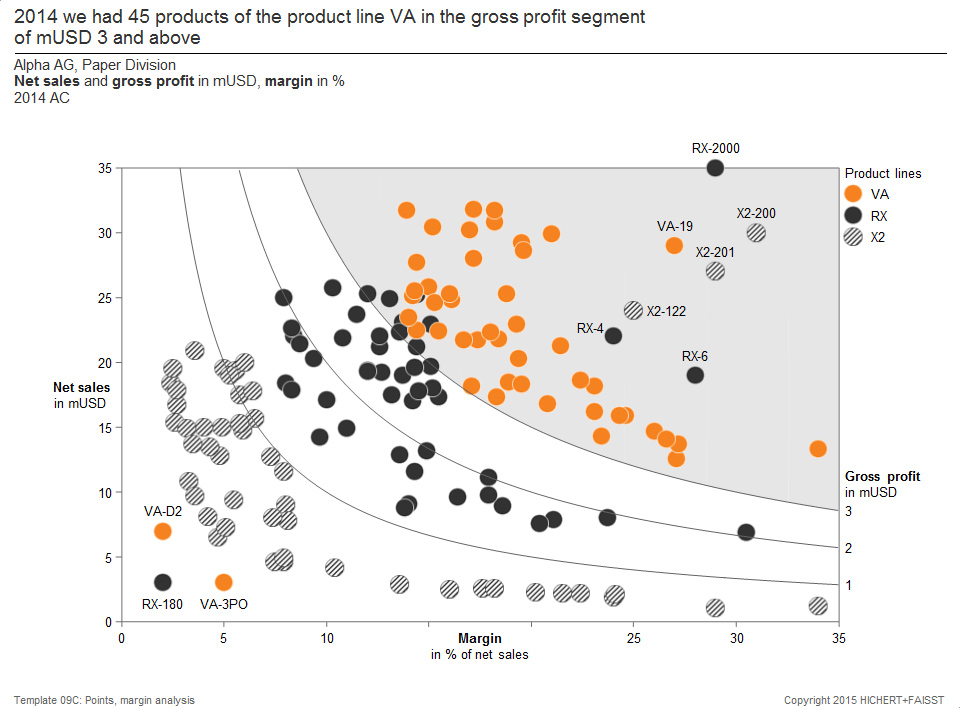
Bubbles and points
XY charts have two value axes X and Y, on which coordinate range the points or bubbles are positioned. A third dimension can be represented by the bubble size. In special cases, a fourth dimension as a piece of pie in a bubble may be a relative proportion.
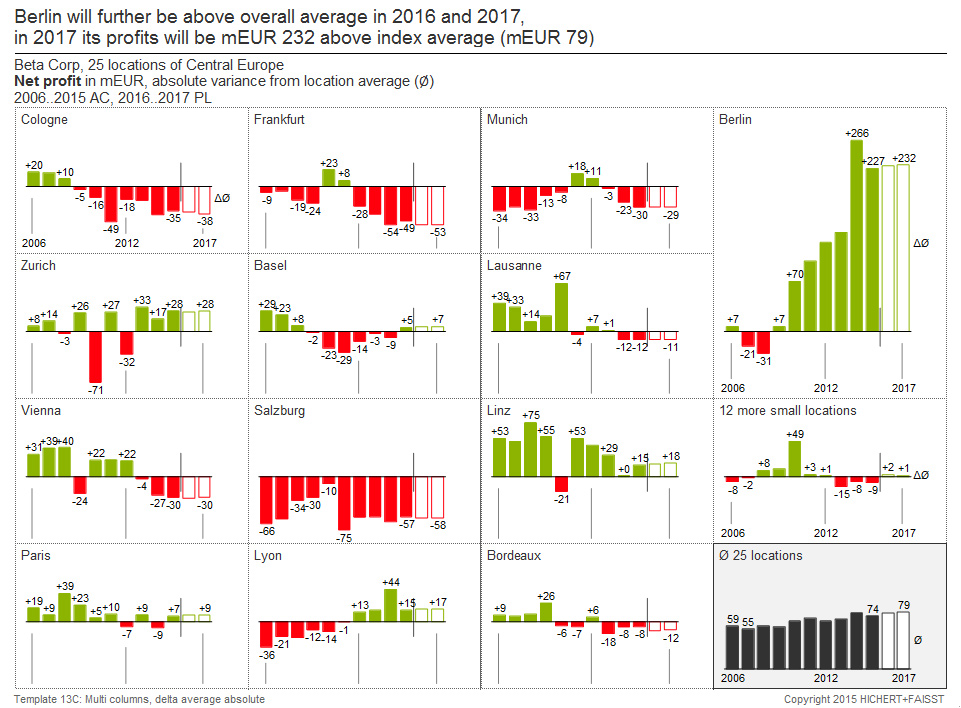
Tree charts and small multiples
So-called small multiples are several similar charts, which usually have a simple structure. One specific dimension is used as a chart multiplier. In the location analysis shown here this is the dimension of the locations. A chart is displayed for each element of the locations dimension.
read more
In tree charts, the arrangement of the charts in a tree structure is illustrated in order to illustrate a calculation path, for example, an ROI.
read more
Tables
Tables can represent key figures for calculations, such as profit and loss statements, or structures in rows, and absolute and relative variances from PREVIOUS YEAR and PLAN in columns. The variance number columns can be replaced by bars and needles.
What our customers say
![]()
We from Controlling as well as the management of G.L. Pharma are enthusiastic about the presentation possibilities and will create many other powerful diagrams in the course of our standardization with hi-chart.
Thanks to Hi-Chart’s competent project support, we were able to quickly and inexpensively implement well-understood charts with hi-chart.
(Translated from German)
Harald Oswald, Andrea Silly
GL-Pharma GmbH, Controlling
TRY OUT NOW FOR FREE
With no obligation
 Twitter
 Xing
Xing YouTube