

You've got the numbers -
we deliver the visualizations
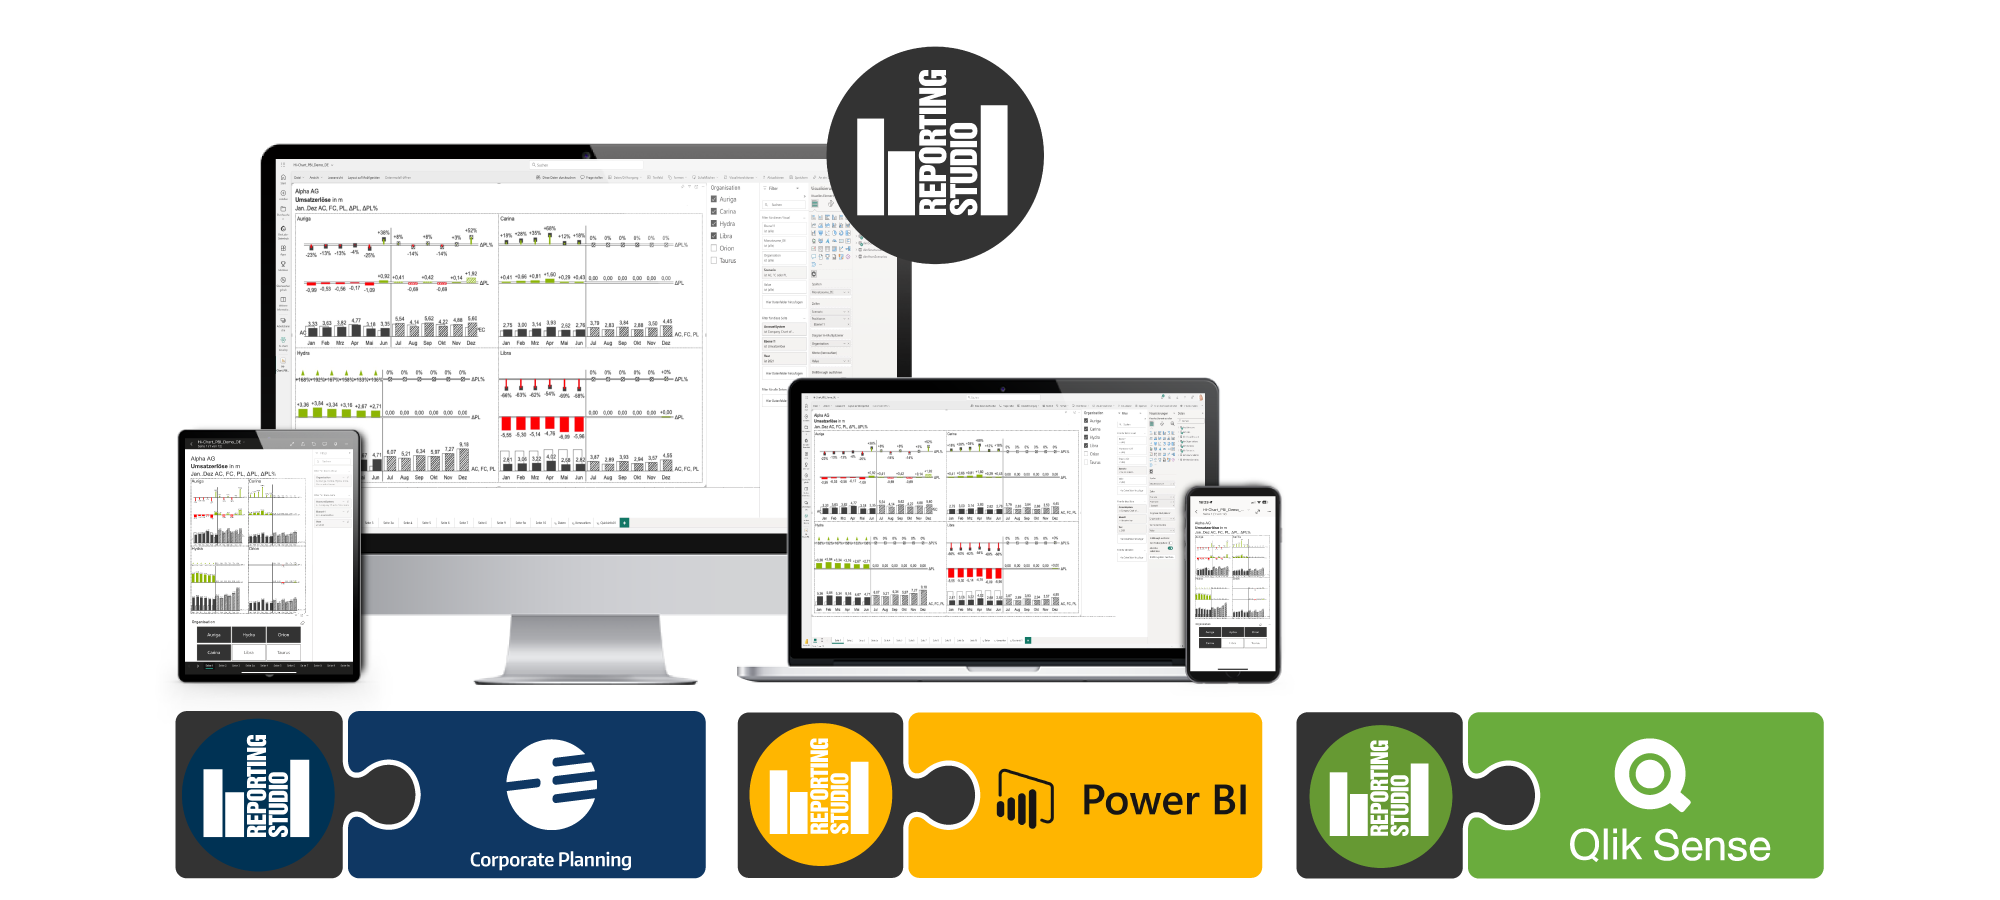
You've got the numbers -
we deliver the visualizations
You've got the numbers -
we deliver the visualizations


TRY OUT NOW FOR FREE!
With no obligation
 Twitter
 Xing
Xing YouTube