
Reporting Studio
runs on different platforms. You work fast and intuitive.
You create your sophisticated management reports, presentations and interactive dashboards in nearly no time.
Reporting Studio is IBCS® certified.
With Reporting Studio you not only create single charts or tables,
but complete multi-page reports with charts, tables, combinations of both, text and highlighting.

CP Reporting Studio
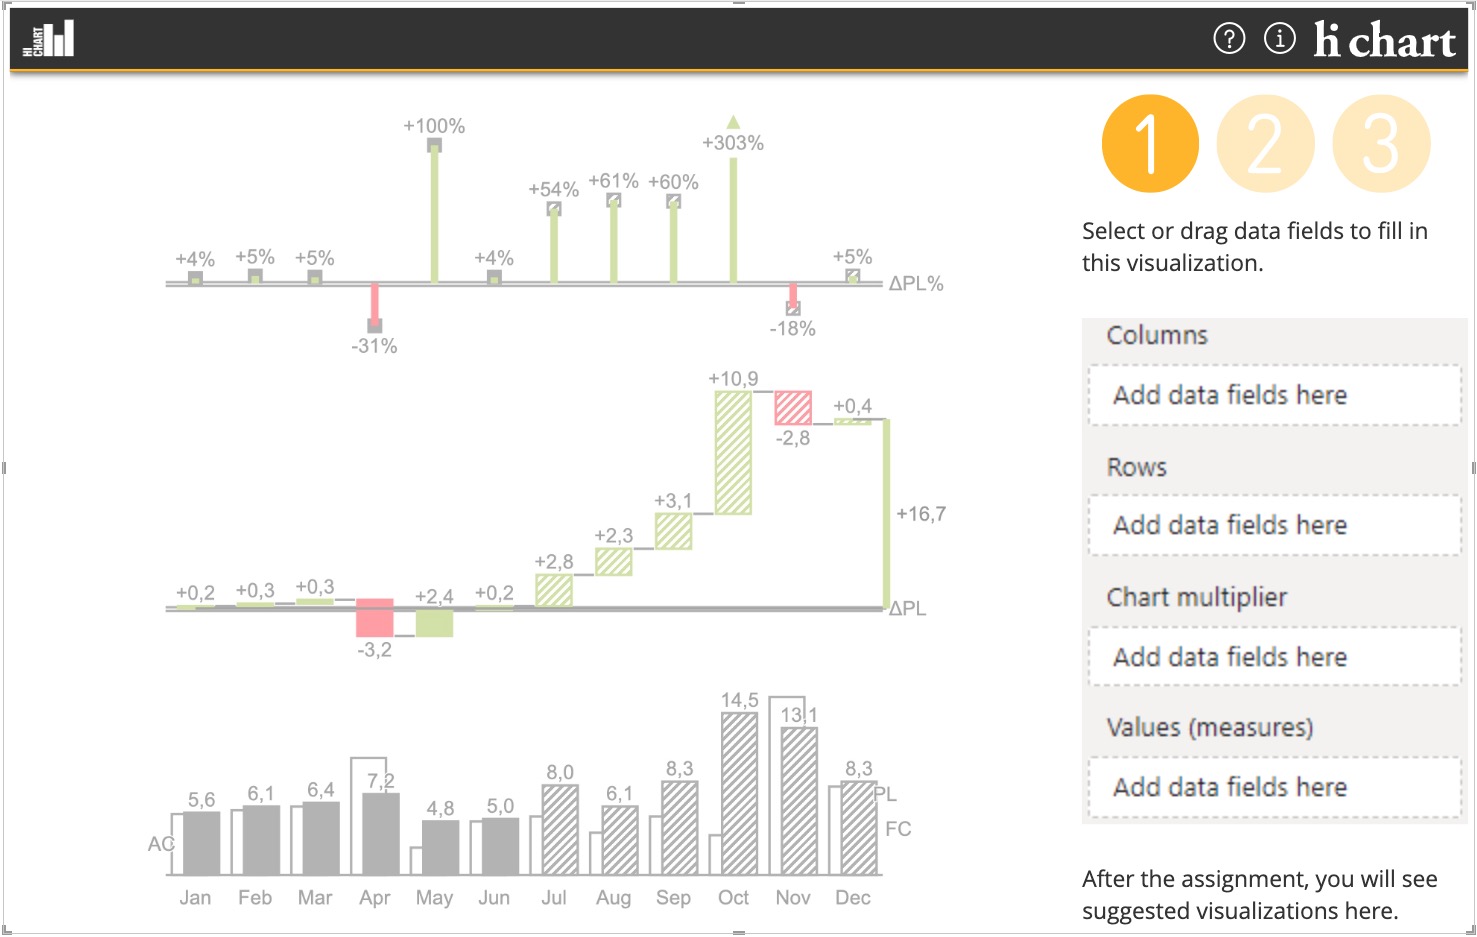
With CP Reporting Studio you can create compelling business graphics and tables in multi‑page reports.
The data sources are analysed for their business logic, and the best graphic types for a perfect visualization are suggested.gen.

hi-chart Reporting Studio
for Power BI
Reporting Studio is also available as a visual for Power BI.
Designers benefit from the automatic chart suggestions that hi-chart presents for the available data.
Report users benefit from its built-in notation concept and the perfectly designed graphics, which ensure that the information provided is instantly understood.

hi-chart Reporting Studio
for Qlik Sense
Reporting Studio is also available as an extension for QLIK Sense.
Here too, designers will benefit from its automatic chart suggestions for the available data.
And, thanks to its built-in notation concept and the perfectly designed graphics, dashboard viewers can quickly and correctly interpret the information provided.

FAST
Analysing your business figures is what you’re really supposed to be doing – but creating the management reports beforehand takes up valuable time. With Reporting Studio, that job’s done in no time at all!

intuitive
Many software solutions are highly complex and can only be used efficiently after a lengthy period of familiarization. With Reporting Studio it’s completely different: you can put your graphic together simply by drag & drop and adjust each element afterwards if necessary.

easy
Reporting Studio suggests the most suitable visualizations based on the available data. To do this, it analyses the data for business significance. You can just sit back and relax while Reporting Studio does it automatically.

compelling
Instead of simply reporting your figures, you let your data tell exactly the story your audience is meant to be told. They can quickly and easily read and fully understand your messages.

efficient
Implementation is effortless and results in informative, crystal-clear visualizations for targeted communication.

versatile
Whether you want to use your graphics in PowerPoint presentations, on screen, for printouts or for print templates, with Reporting Studio you can display single charts and tables or present several graphics together on a page grid. Multicharts are generated completely automatically.

individual
For individual corporate identity, logos can be easily integrated into the entire project. All objects have suitable default settings, which you can also customize as required.

integrated
Reporting Studio is deeply integrated in the Corporate Planner, Power BI and QLIK Sense platforms and enables seamless data handling, filtering and exports.

international
Reporting Studio can speak English, German, Spanish, French, Italian, Dutch, Portuguese, Russian, Serbian and Chinese.
Videos
hi-chart Reporting Studio for Power BI
SCALING MADE SIMPLE
Reporting Studio OBJECTSIZE CONCEPT

In the creation of business charts it has so far only been possible with a great deal of effort to put all sizes of graphic elements – including those of the fonts – into a consistent size ratio. After many years of trying to solve this problem, Rolf Hichert of HICHERT + FAISST has found a solution that is as simple as convincing: the font size concept
THE IDEA
The font size concept is based on the idea of using the font size of a business graphic as a reference for all other sizes and proportions. For example, if the default font size is 10pt, all other important dimensions on a report page can be expressed as a multiple of these 10pt. A “pt” (Point) is equivalent to 1/72 inch.
The new unit of measurement is called “fs” for “font size”.

MORE CLARITY IN ALL AREAS
The font size concept thus creates more clarity in all areas: In the creation of business charts, in their use in different output media, presentations and reports as well as the actual purpose: the use by managers and decision makers.

ALWAYS CONSISTENT
For example: For a chart, the column thickness is set to 1.0 fs, the category width is 2.0 fs, the column font spacing is set to 0.3 fs, and so on. The result: all fonts and diagram elements are in a reasonable ratio to each other, the maximum size of possible labels is clearly defined, which makes the work even easier. The chart can also be easily enlarged or reduced. Text and graphics always remain coherent. The concept can also be applied to tables and the entire layout of report pages.
APPLICATION IS MORE THAN EASY
The font size concept not only increases the legibility and usability of business charts, but also helps to significantly reduce expenses in reporting. We are so convinced by this solution that we have built this feature into all Reporting Studio products. The application is more than simple: When you insert a chart, you choose a font size – or the font size of the page is used automatically – and the entire chart is automatically configured accordingly. All images have the same look for the viewer, regardless of whether they are thumbnails, for example, in dashboards or enlarged detail sections. Of course, the font size can be changed at any time. Then, all sizes are automatically adjusted.
WHAT OUR CUSTOMERS SAY
![]()
“When working with hi-chart, you can feel the joy of the HI-CHART product developers:
They were allowed to put the IBCS know-how built up with their Excel add-in for years into a separate product of pure HTML5.
The user guidance is extremely intuitive, because it is based on the economic significance of the content to be displayed.
I haven’t seen that before. “
(Translated from German)
DR. JÜRGEN FAISST, MEMBER IN THE IBCS CERTIFICATION TEAM
commented the certification of Chart-me WEB in December 2015
(More from BARC, HICHERT+FAISST)
TRY OUT NOW FOR FREE!
With no obligation
 Twitter
 Xing
Xing YouTube