


Create easy-to-understand charts and tables in an intuitive interface
In this free webinar we offer a non-binding introduction to the possibilities of Chart-me.
Date and time:
Tuesday, May 19, 2020 (in german language)
4:30 – 5:00 pm CEST
Tuesday, May 19, 2020 (in english language)
5:30 – 6:00 pm CEST
Topics
- Link data from Excel, SAP BW and Cognos TM1
- Simply export final PowerPoints and PDFs
- Share reports and dashboards with an email link
- Work in Excel or in a web interface
- Create live data connections to
We create three different graphs as a demo
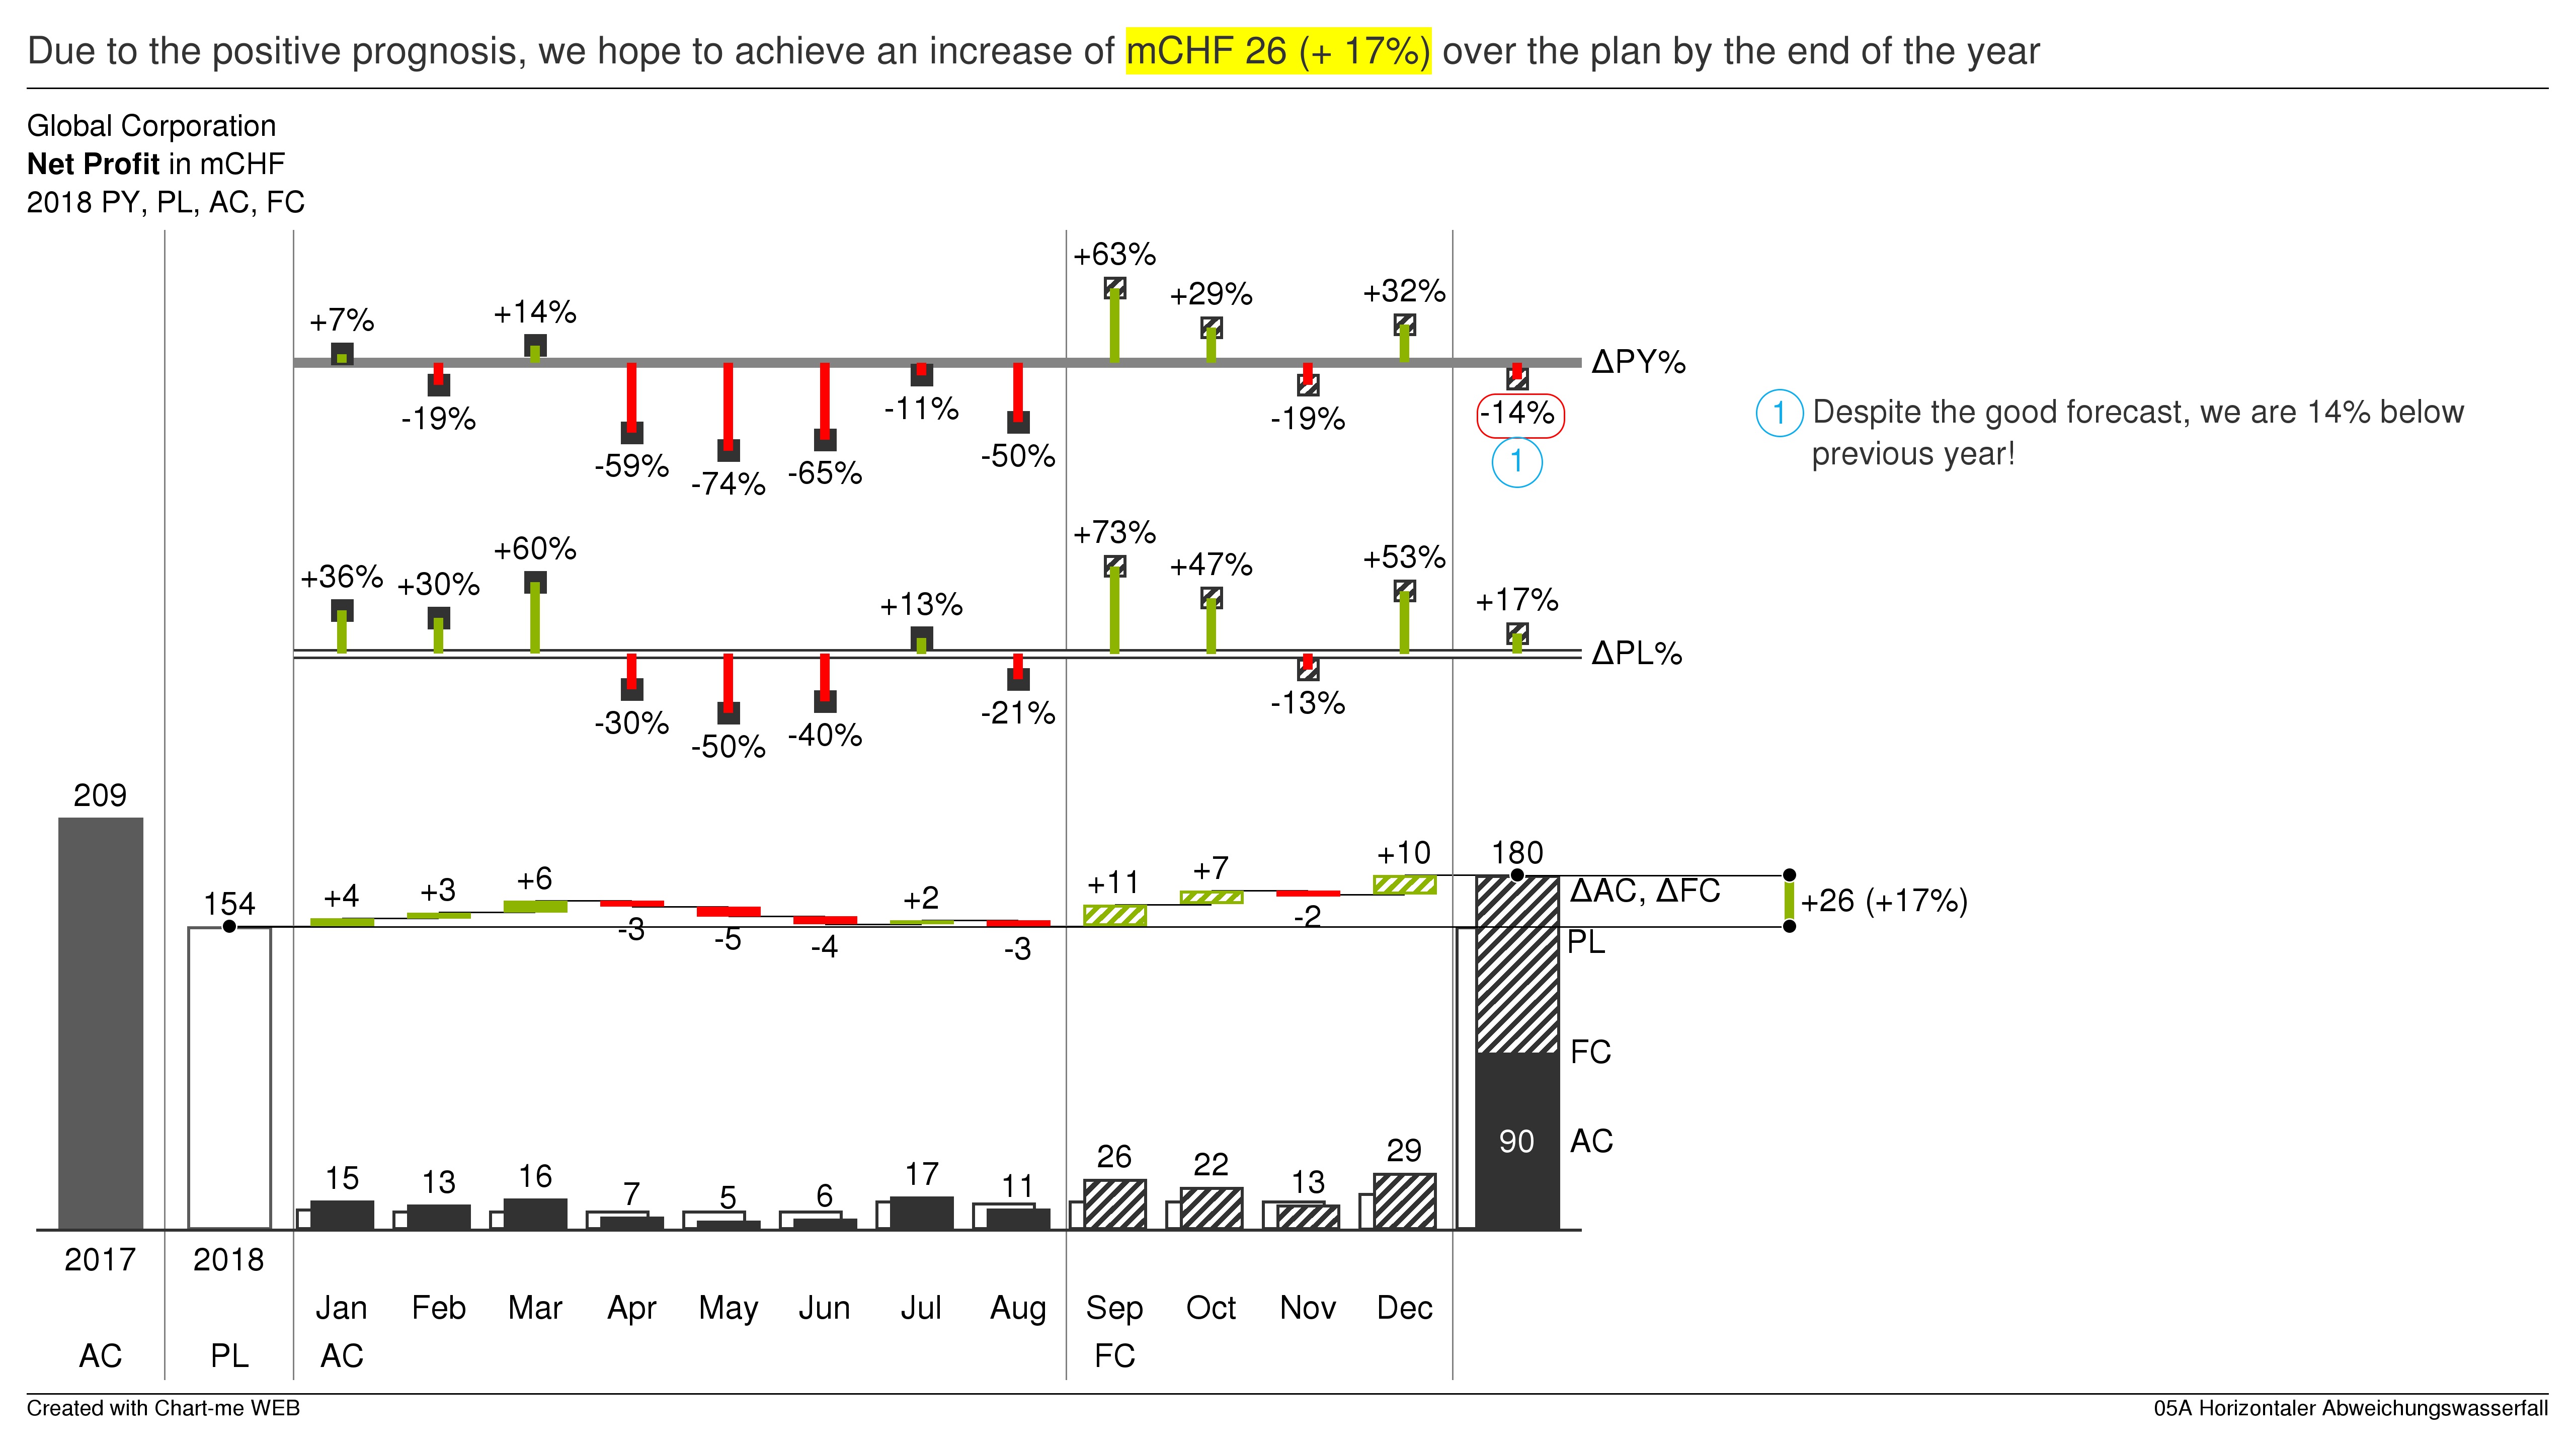
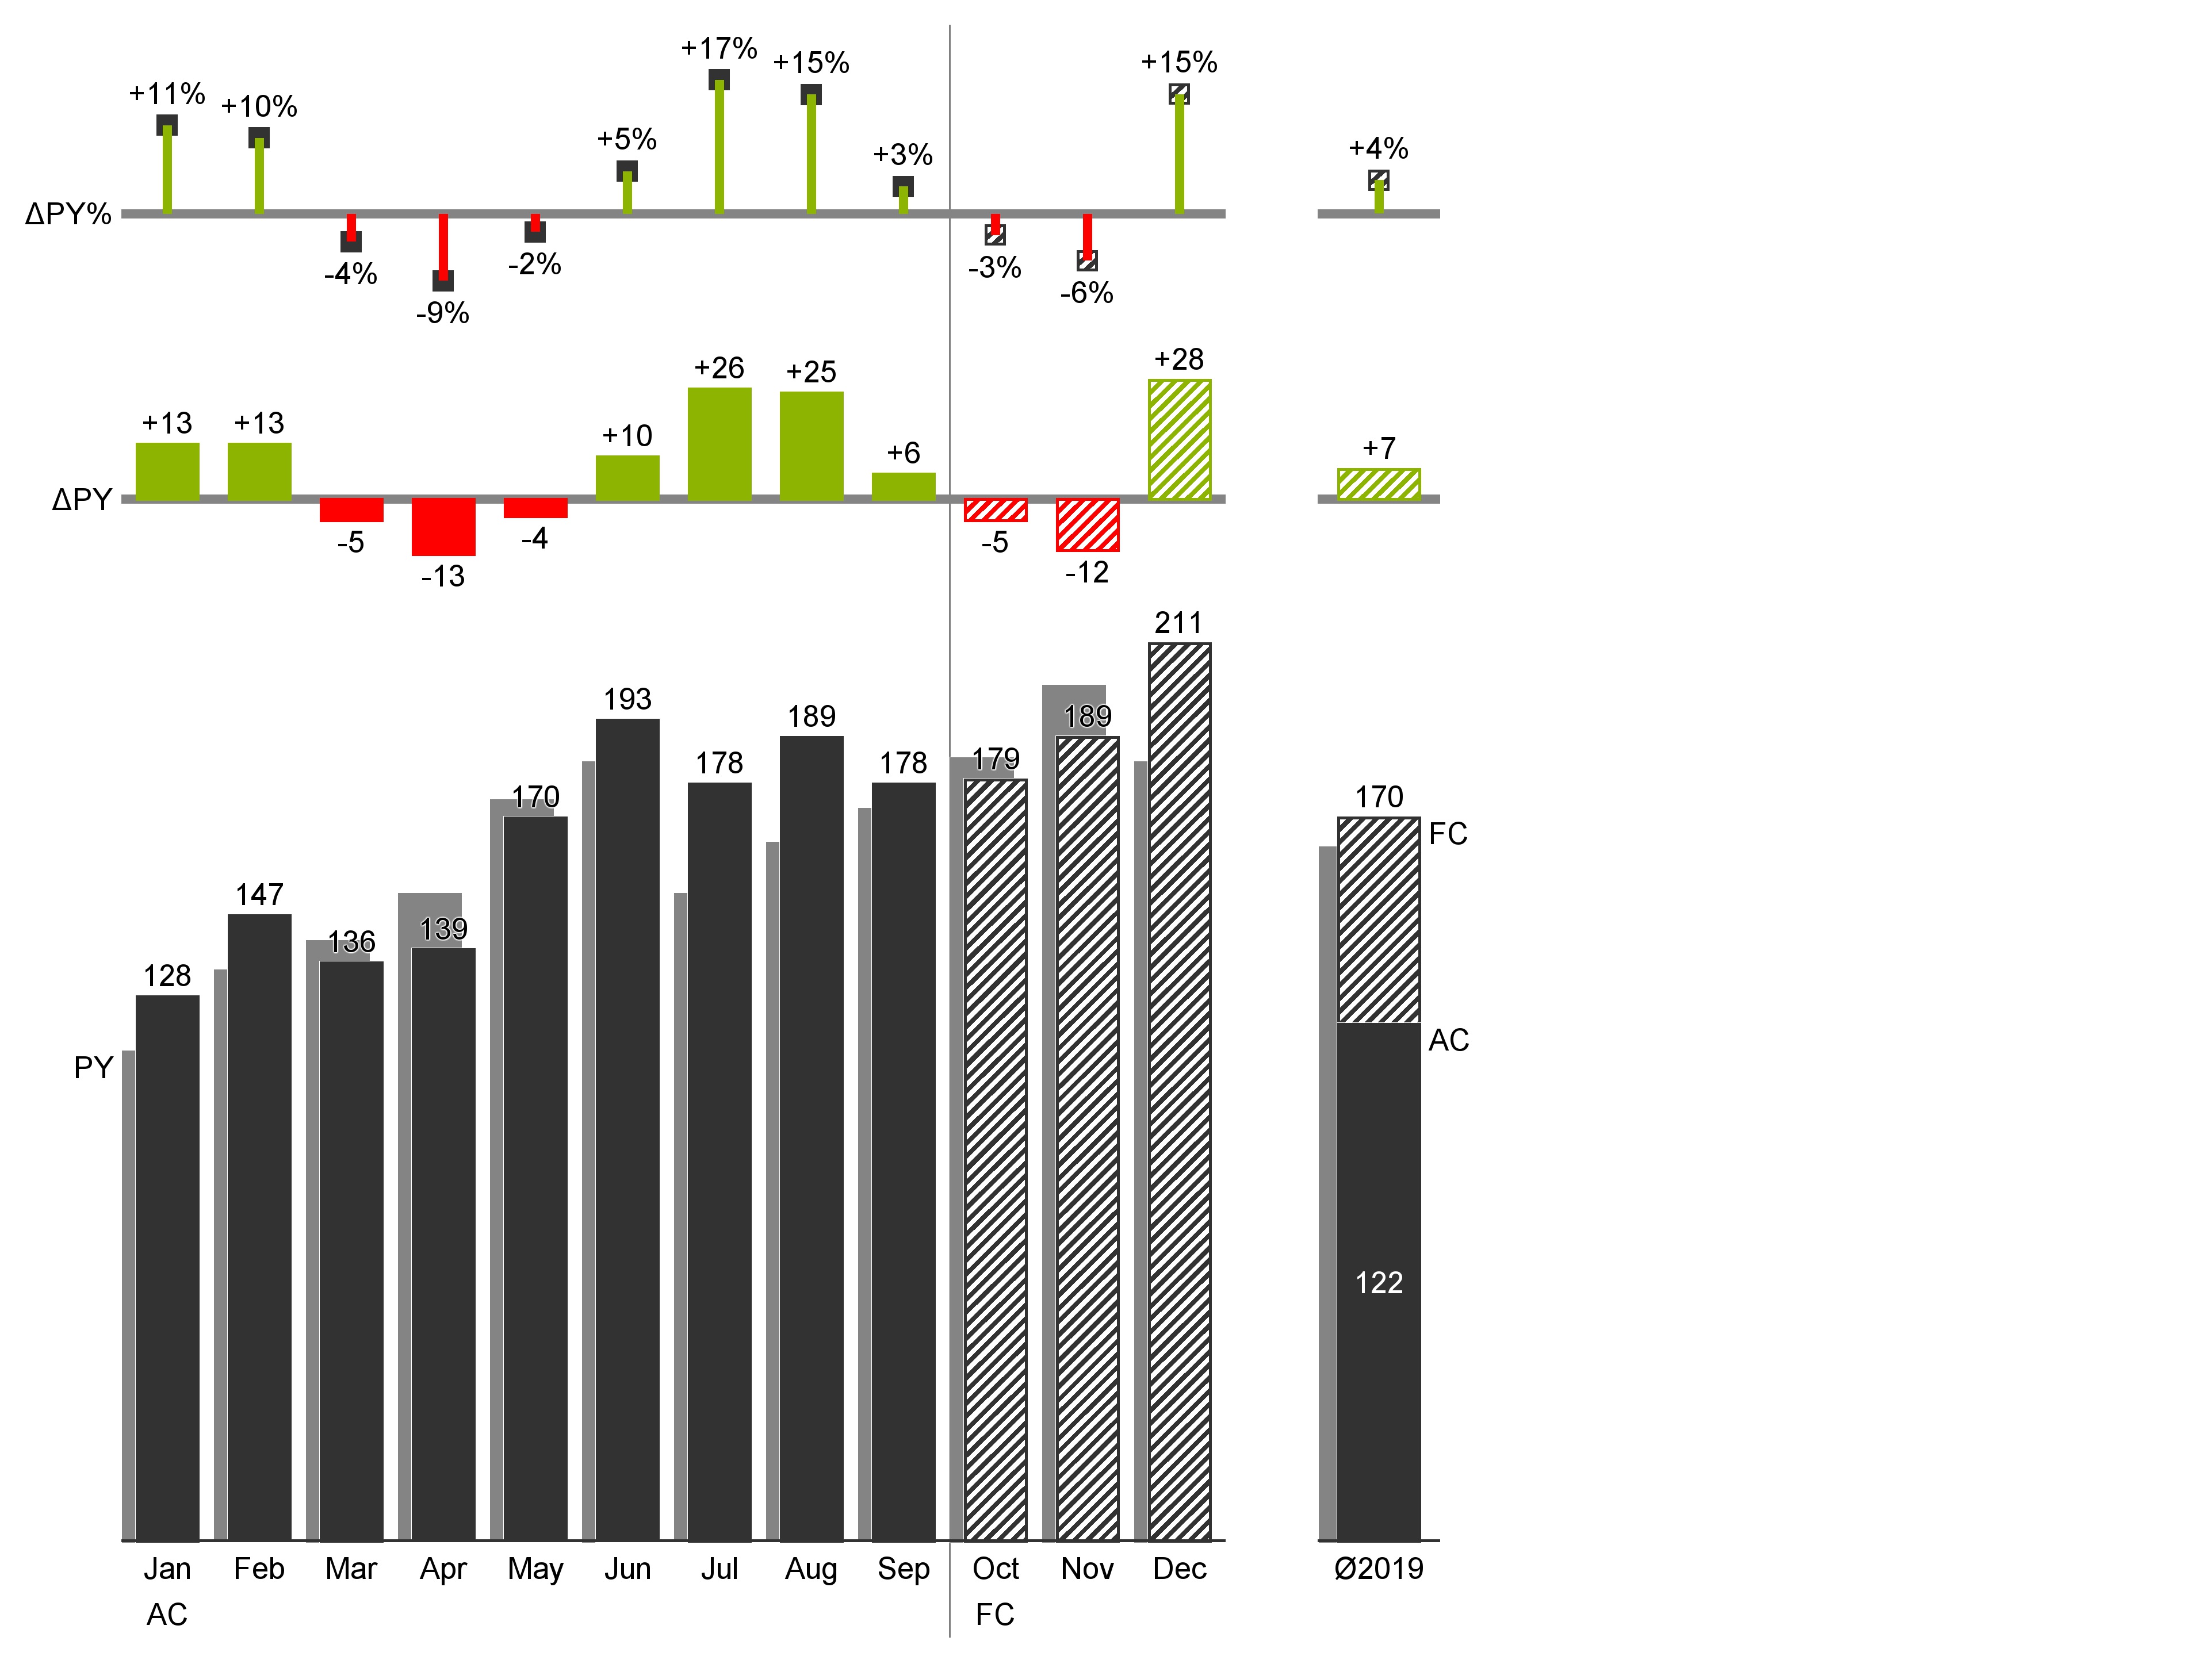
- ACTUAL-PLAN time series analysis with variances on separate axes
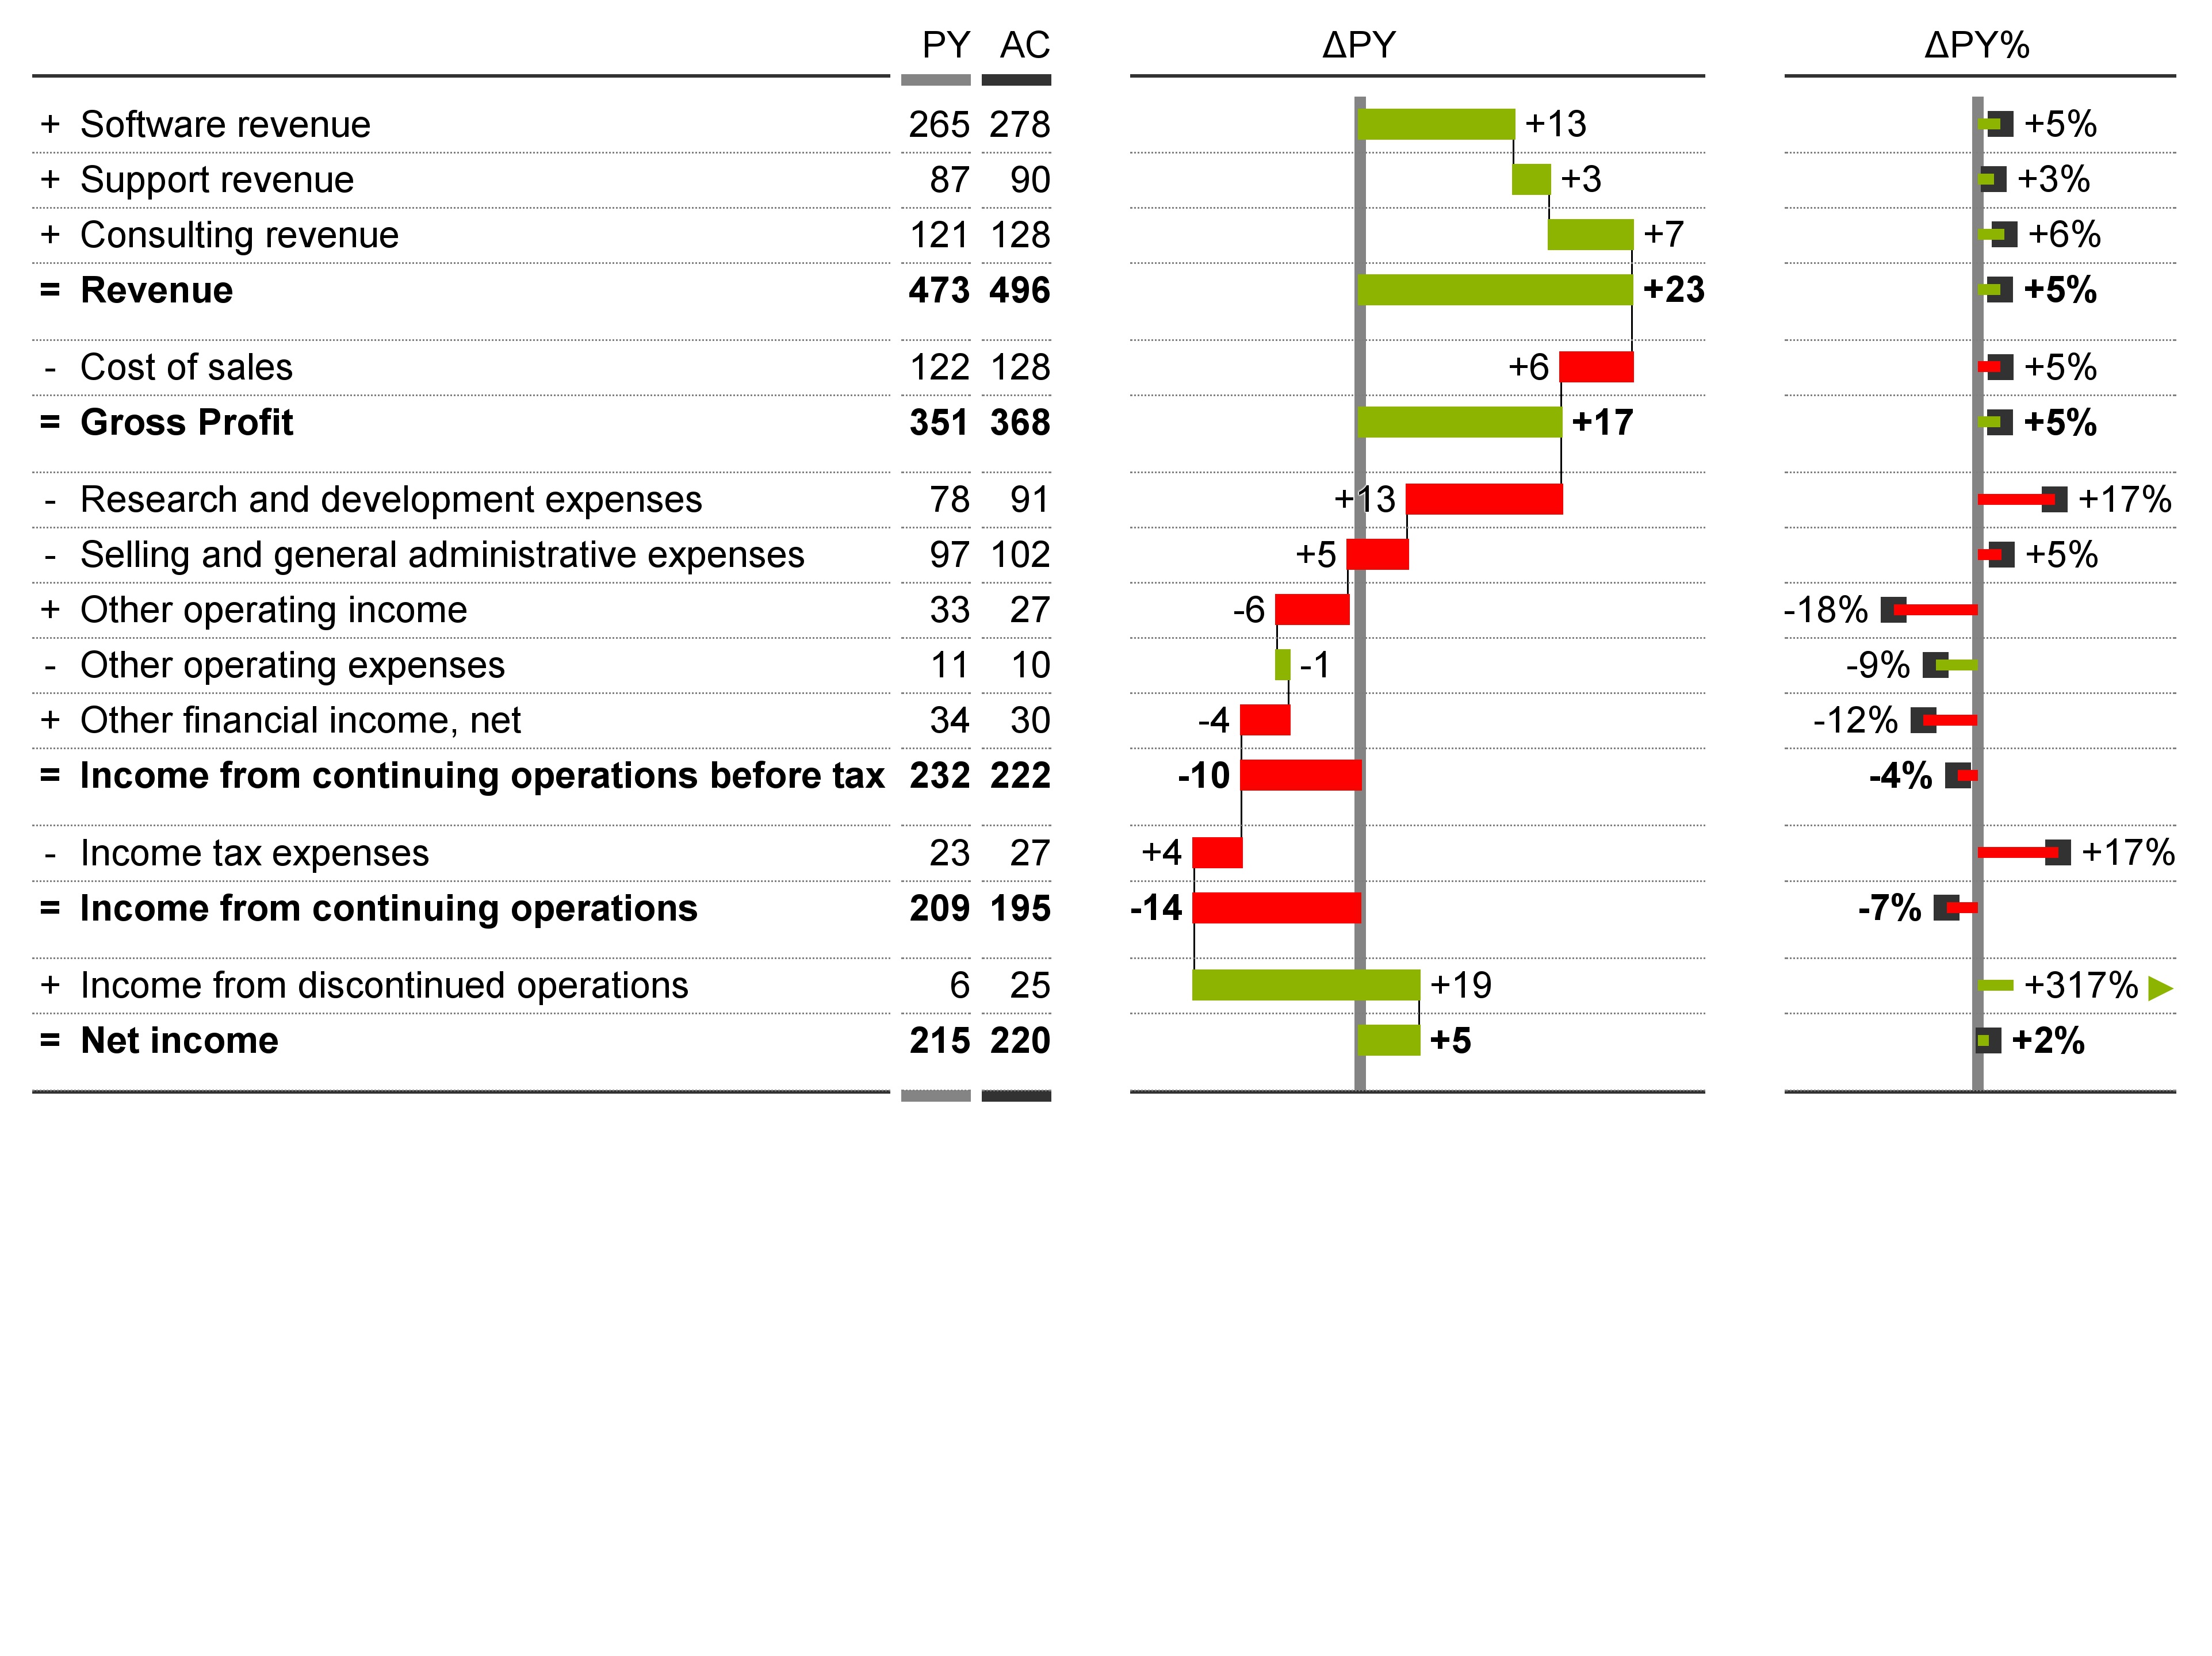
- PnL table with waterfall variances
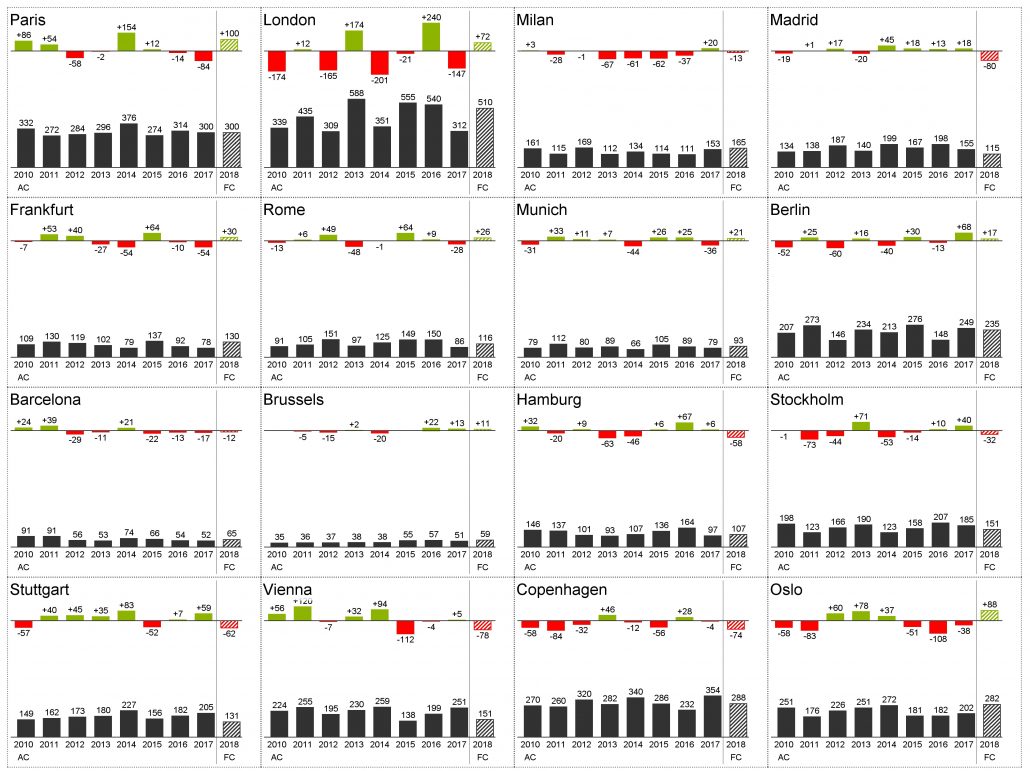
- Region analysis with automatic multicharts
HI-CHART news, offers and more.
Your email address will not be shared with third parties.

 Twitter
 Xing
Xing YouTube
