hi-chart
a data-driven reporting solution in your web browser

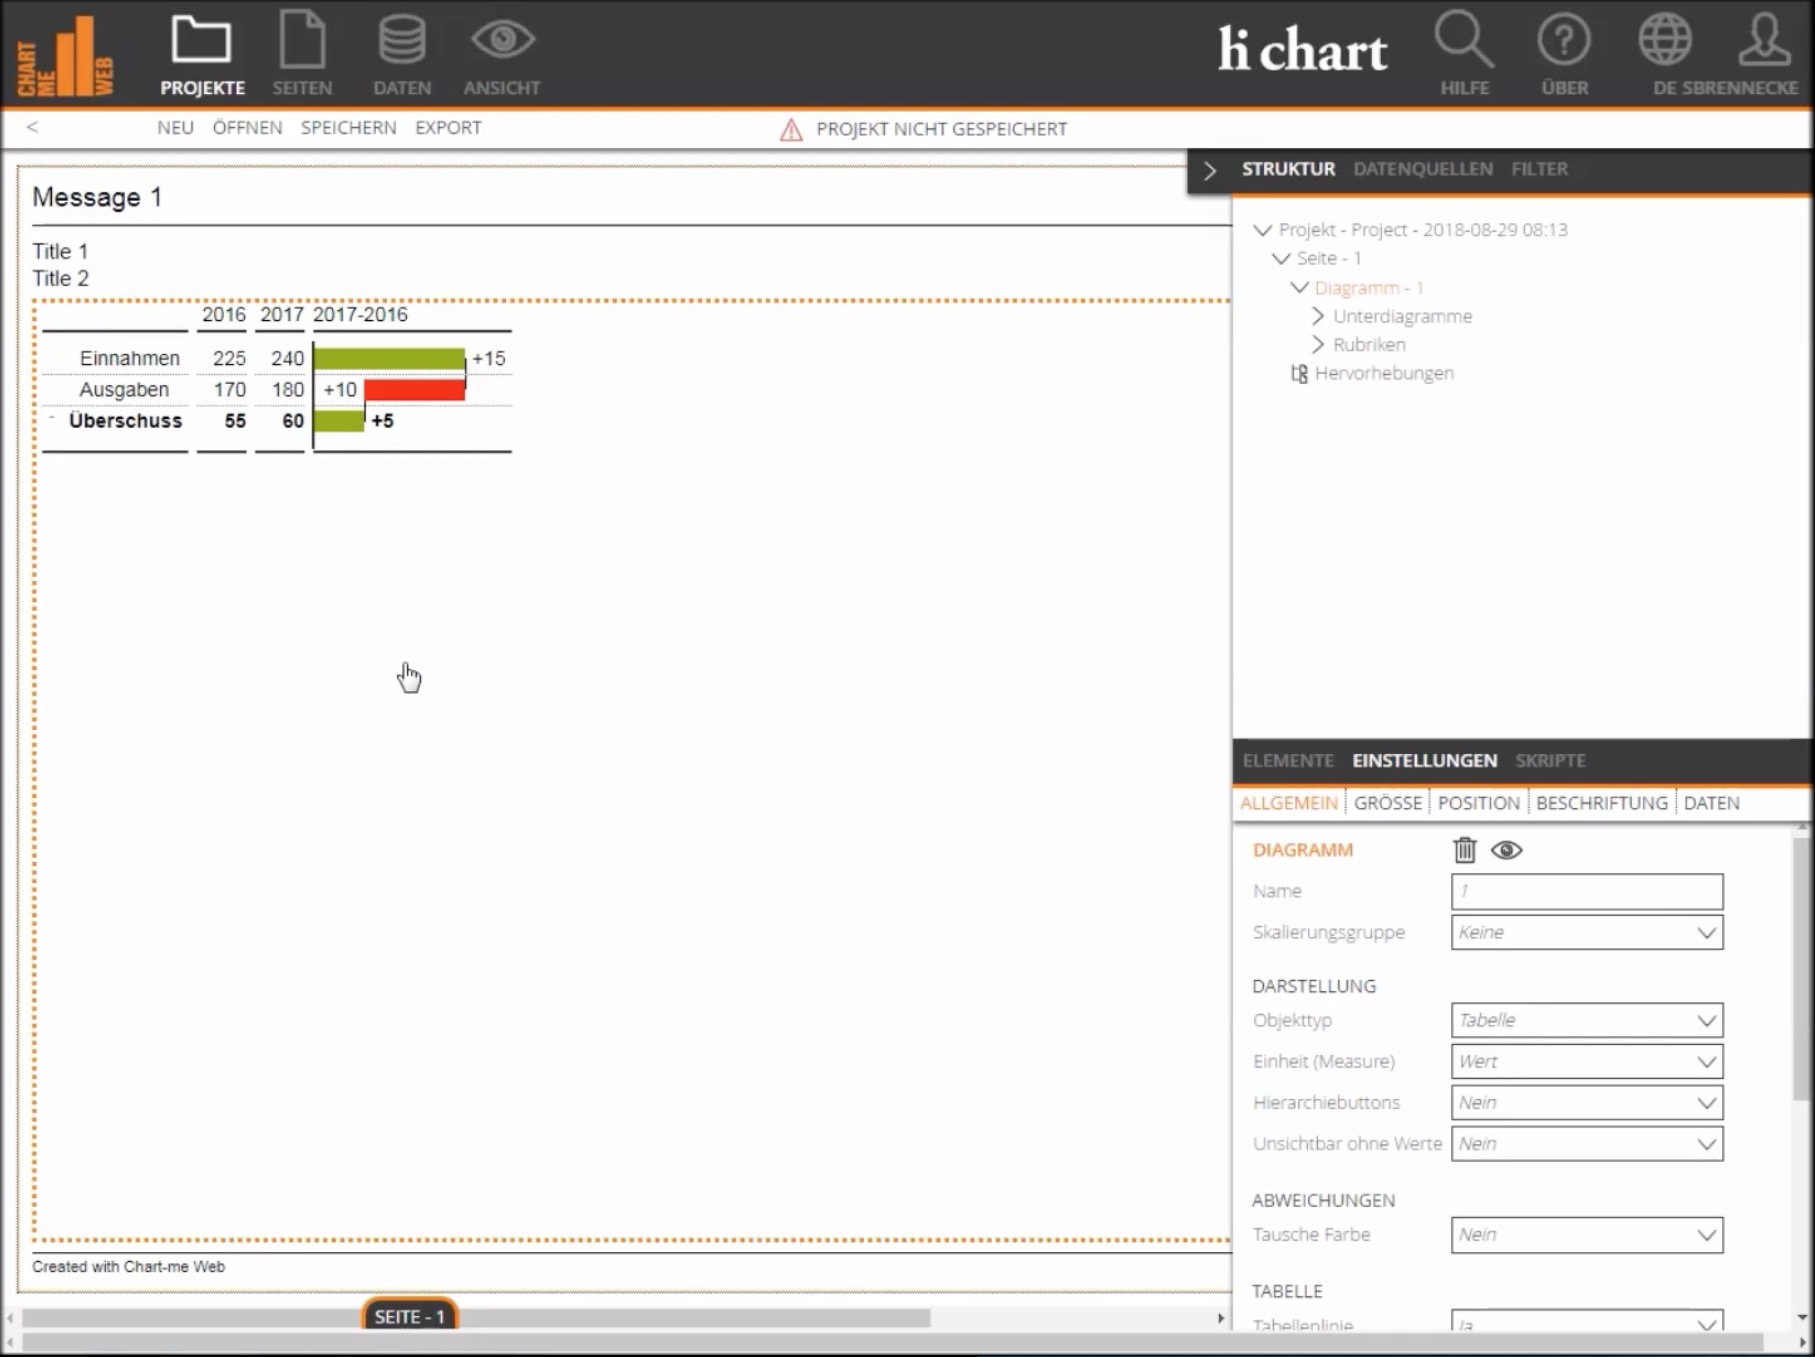
Enhance your company-wide business communications. With hi-chart you create sophisticated management reports, presentations and interactive dashboards quickly and intuitively in a web browser. You can easily apply a range of pre-built FP&A and other business reporting templates, driven by the data sources of your choice – from MS Excel to SAP BW or TM1.
hi-chart® is IBCS® certified.
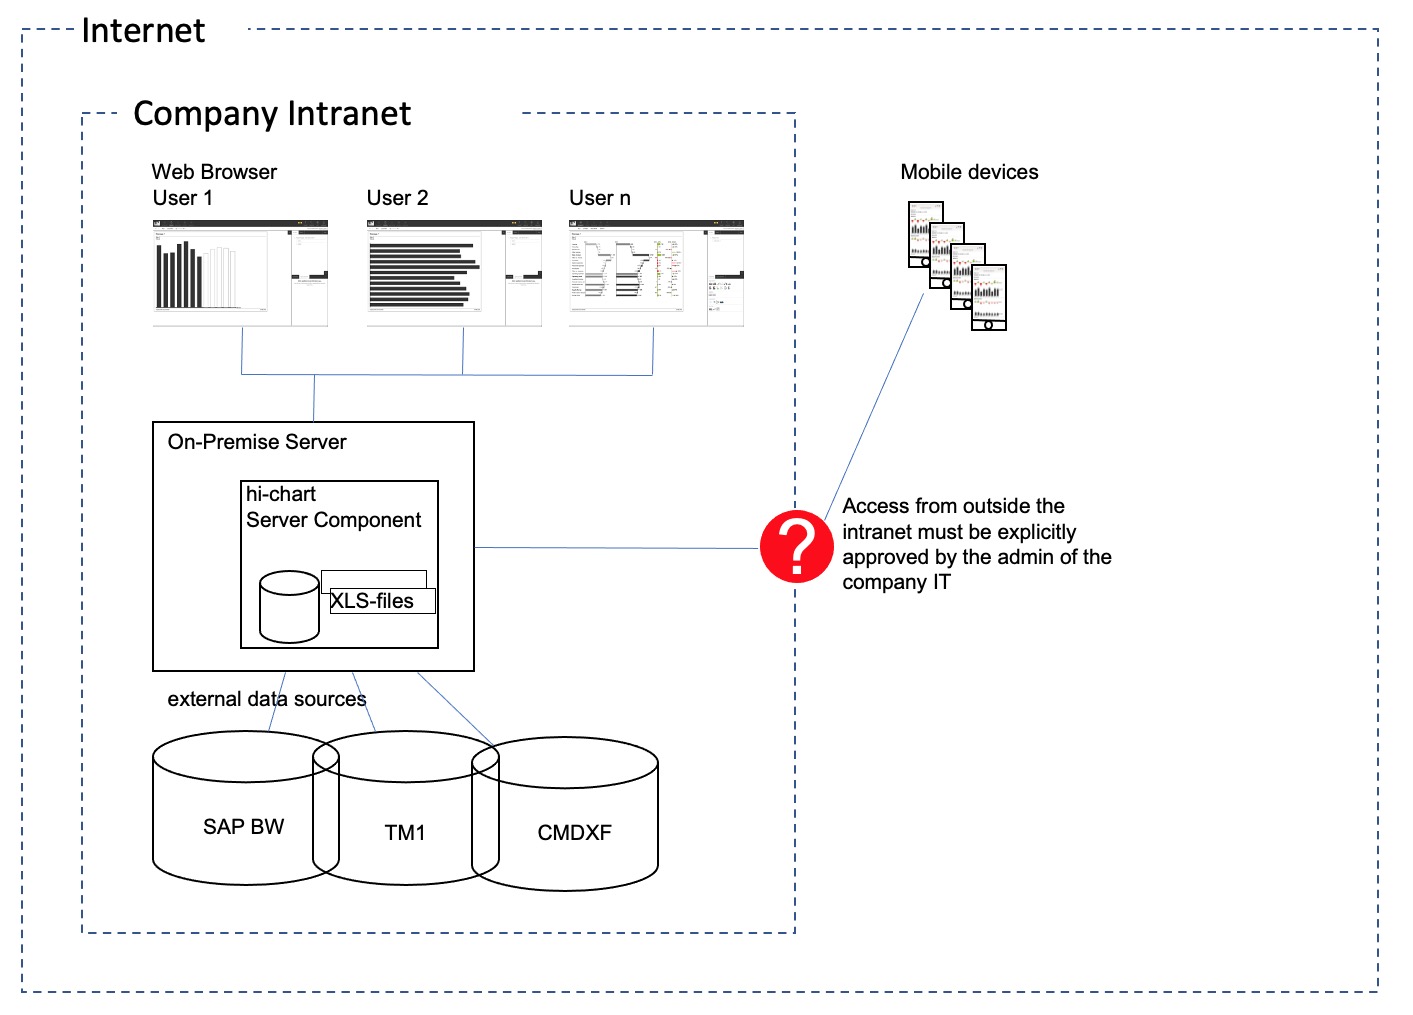
The core component with GUI runs client side in the browser and there are only server accesses on
Server
Clients
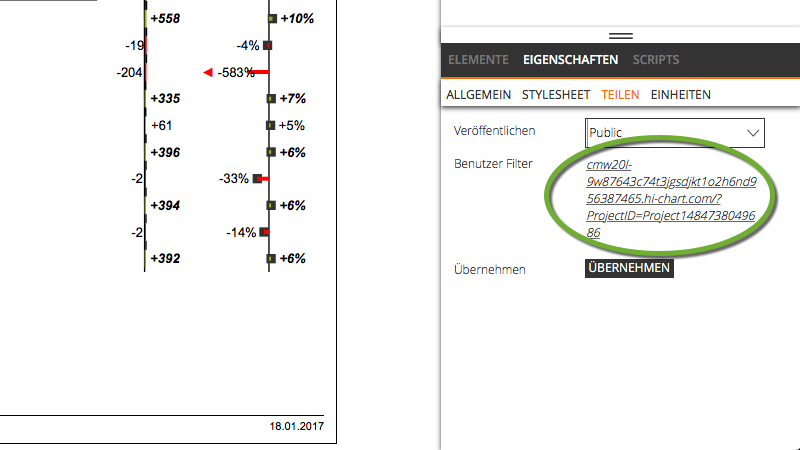
hi-chart projects can also be integrated via iFrames in web pages.
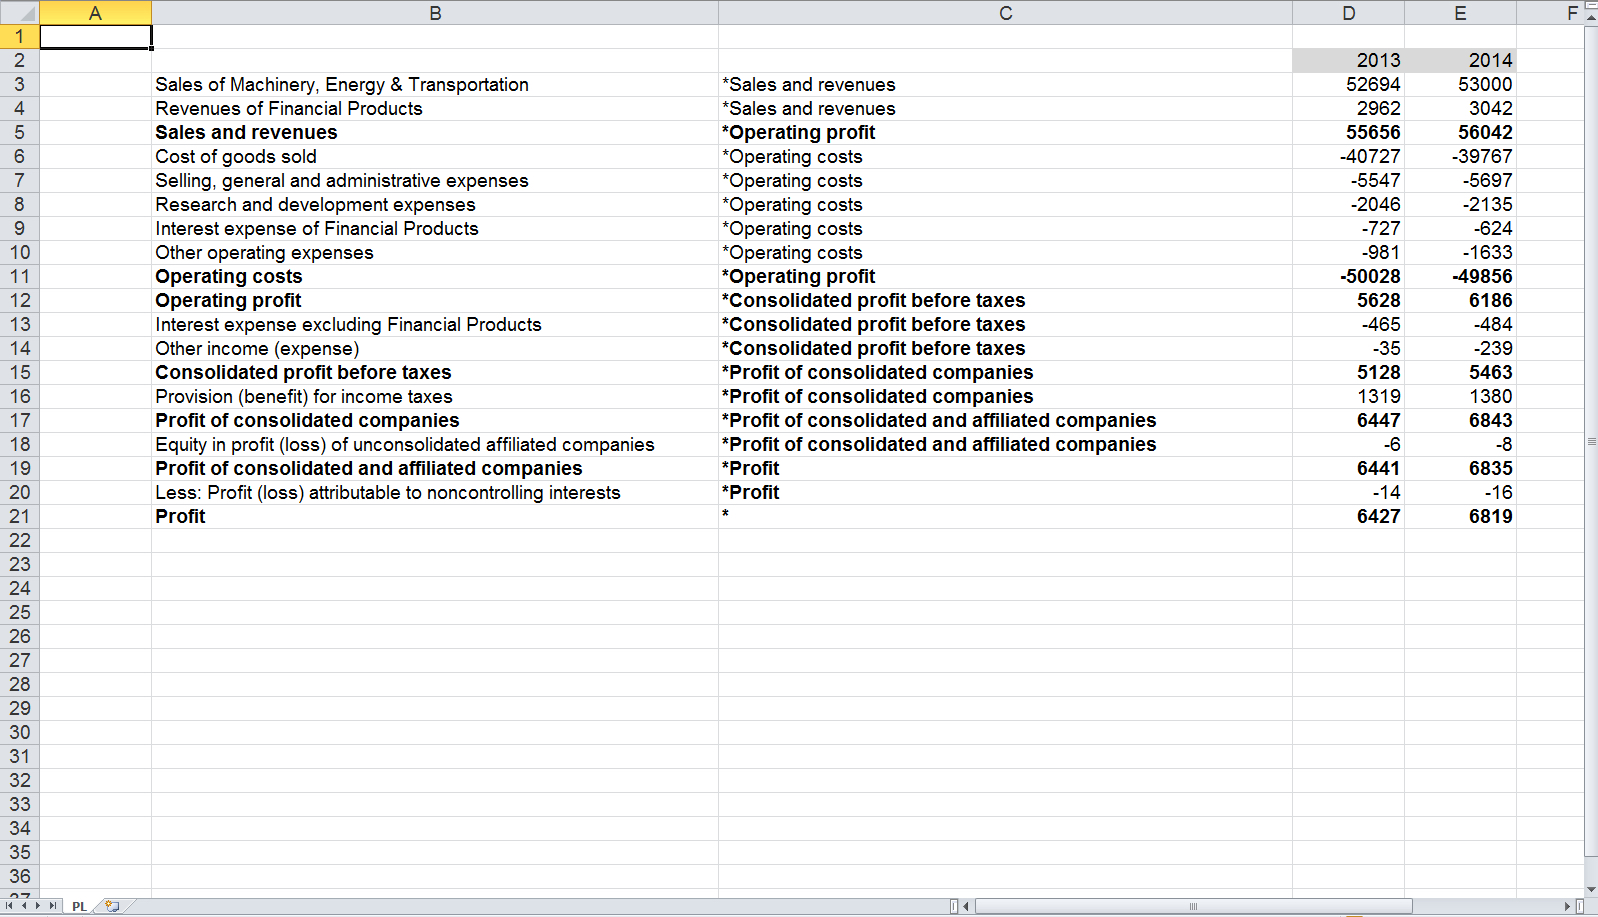
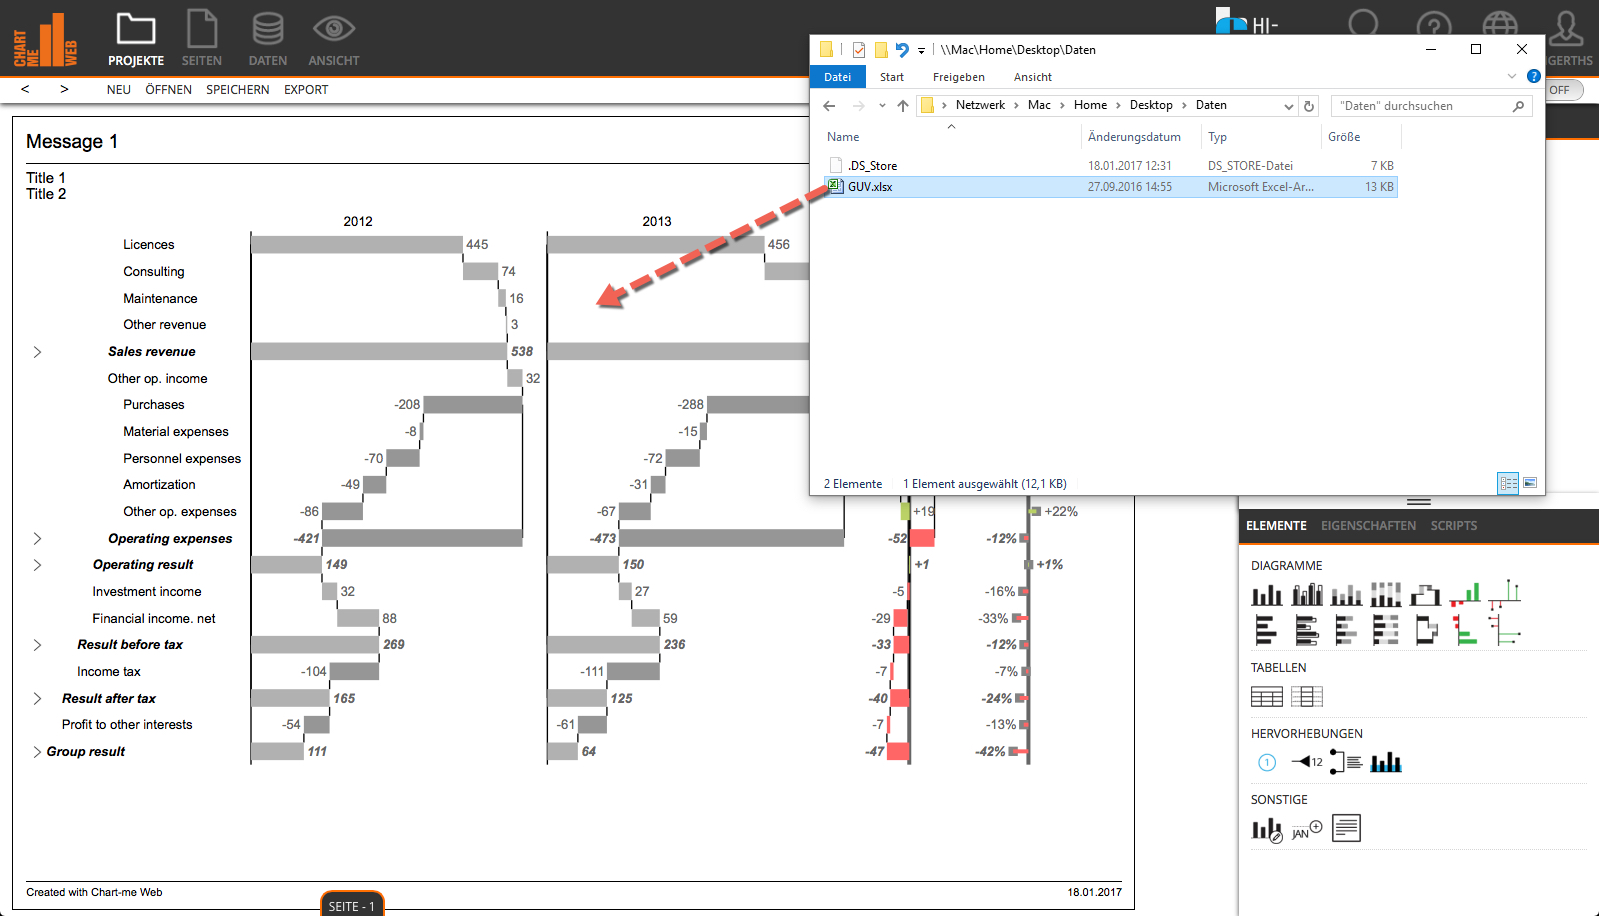
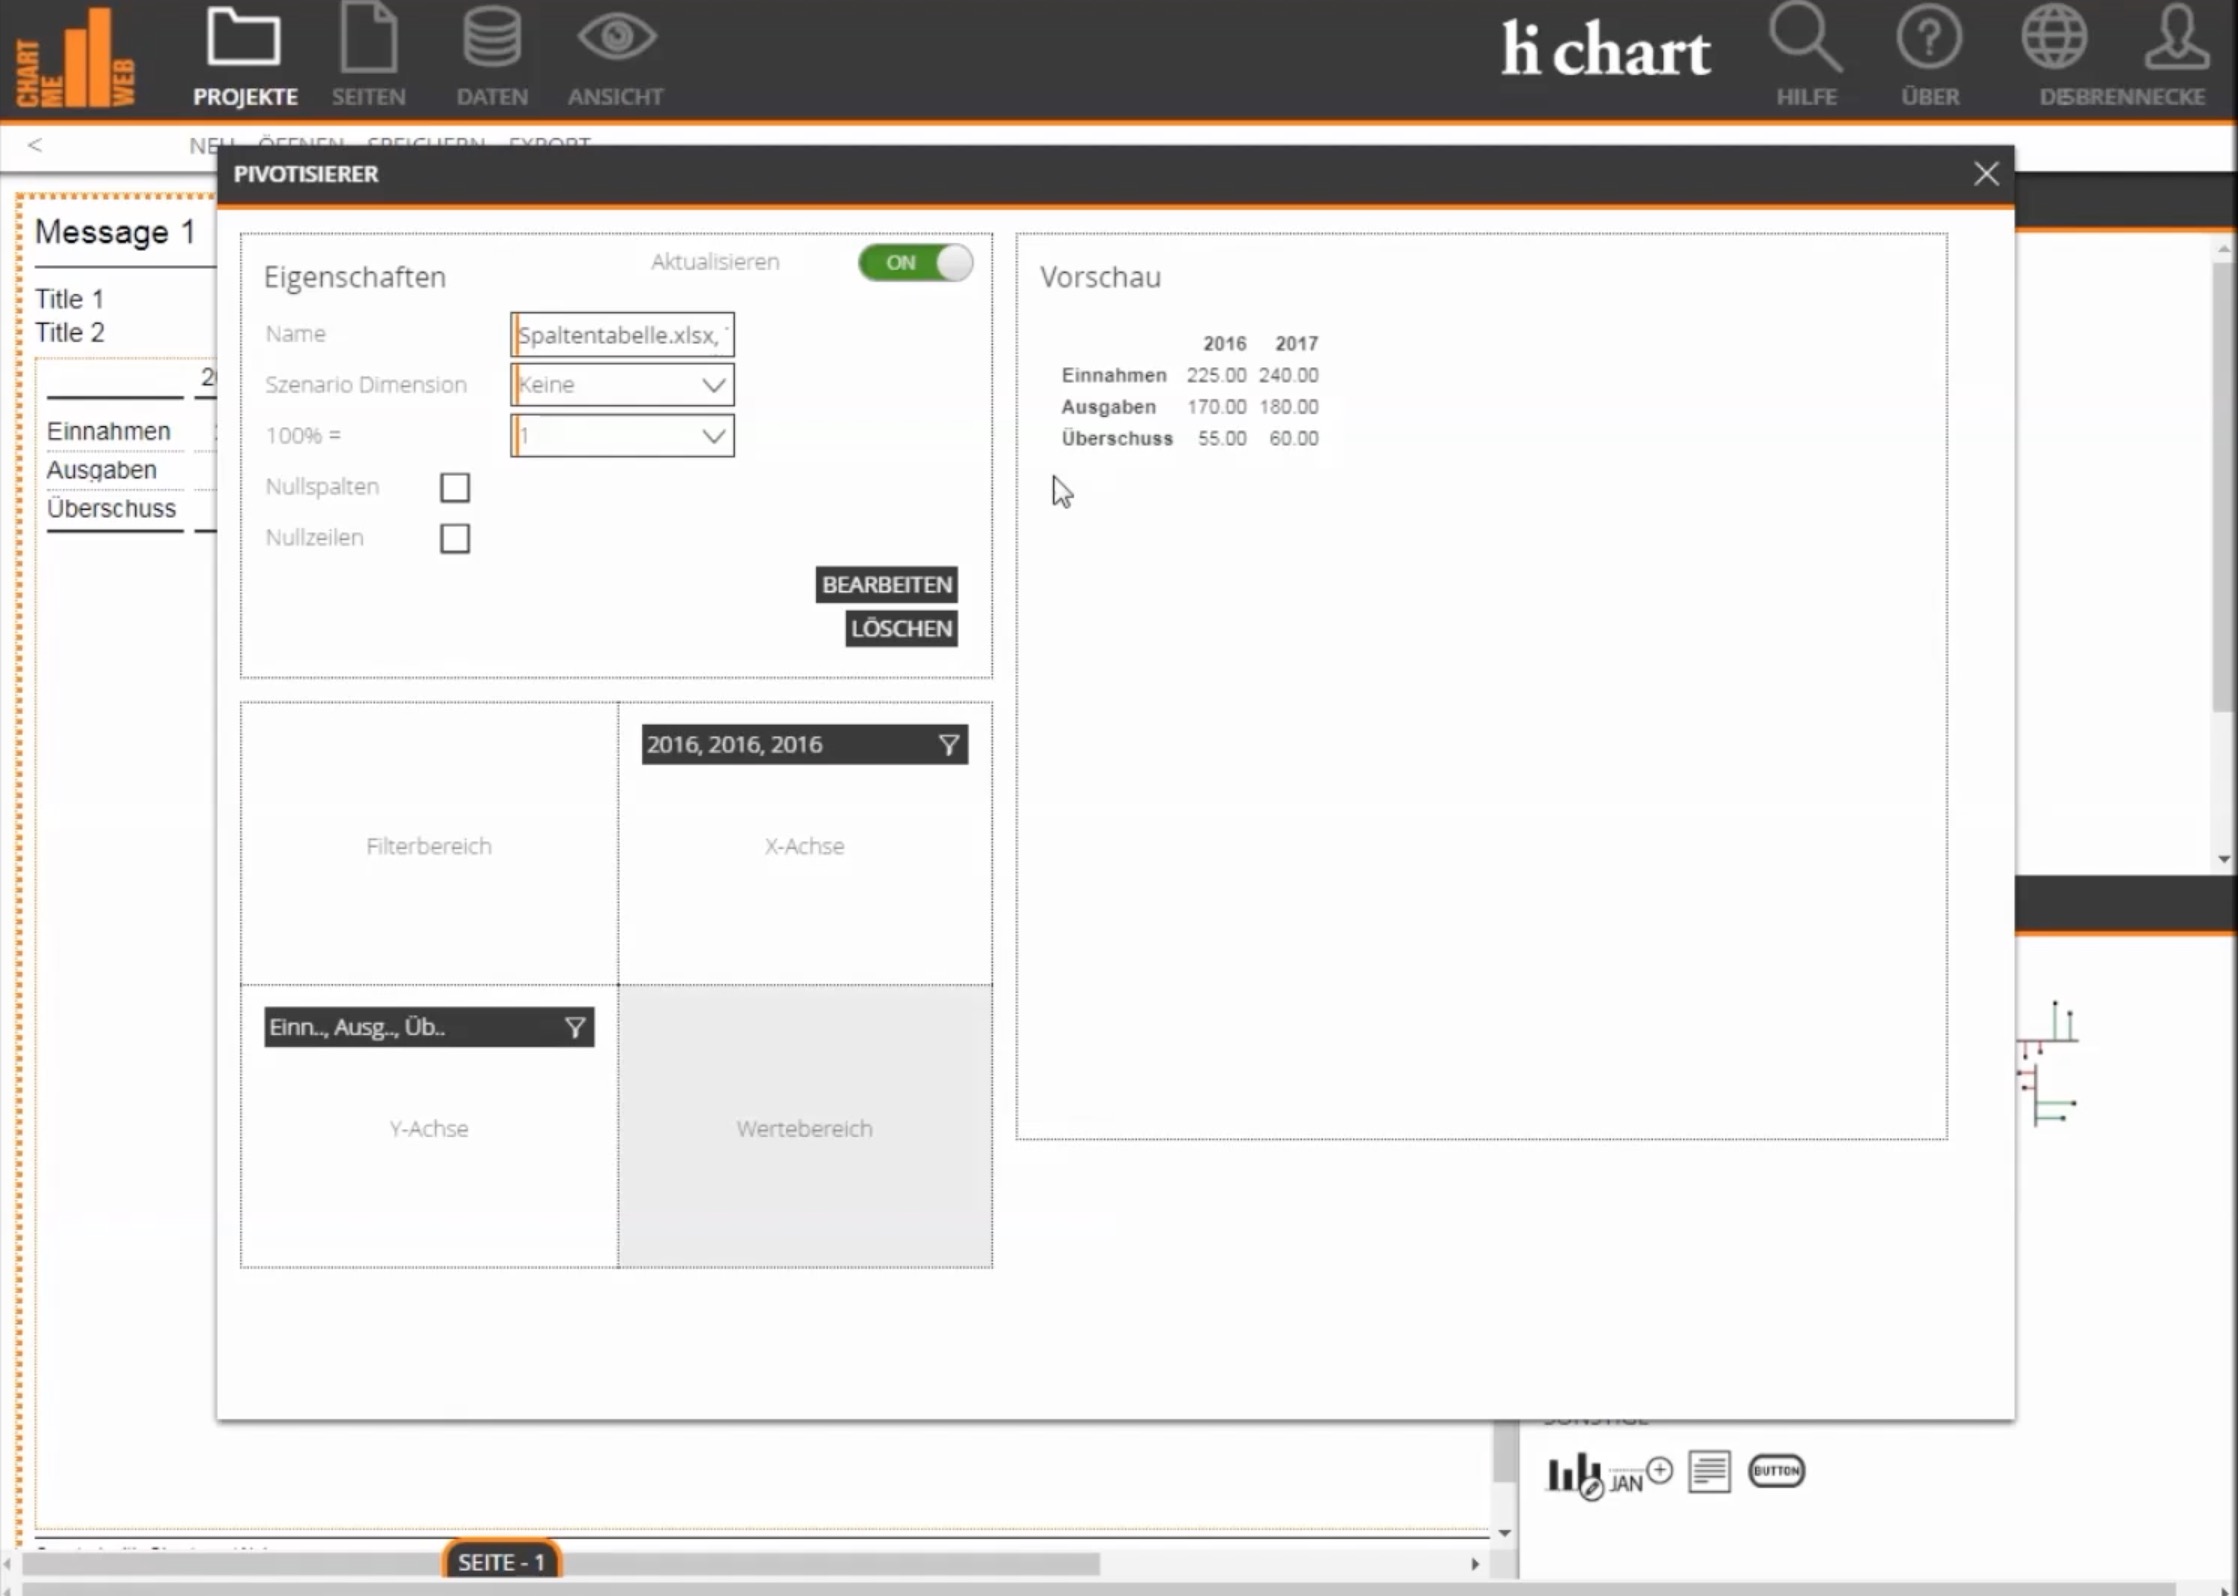
Data can be integrated as CSV files (without server upload) or as XLS / XLSX files (with server upload) in the project for charts and tables.
The files can be dragged and dropped over the browser to newly create a data source or for repeated updating.
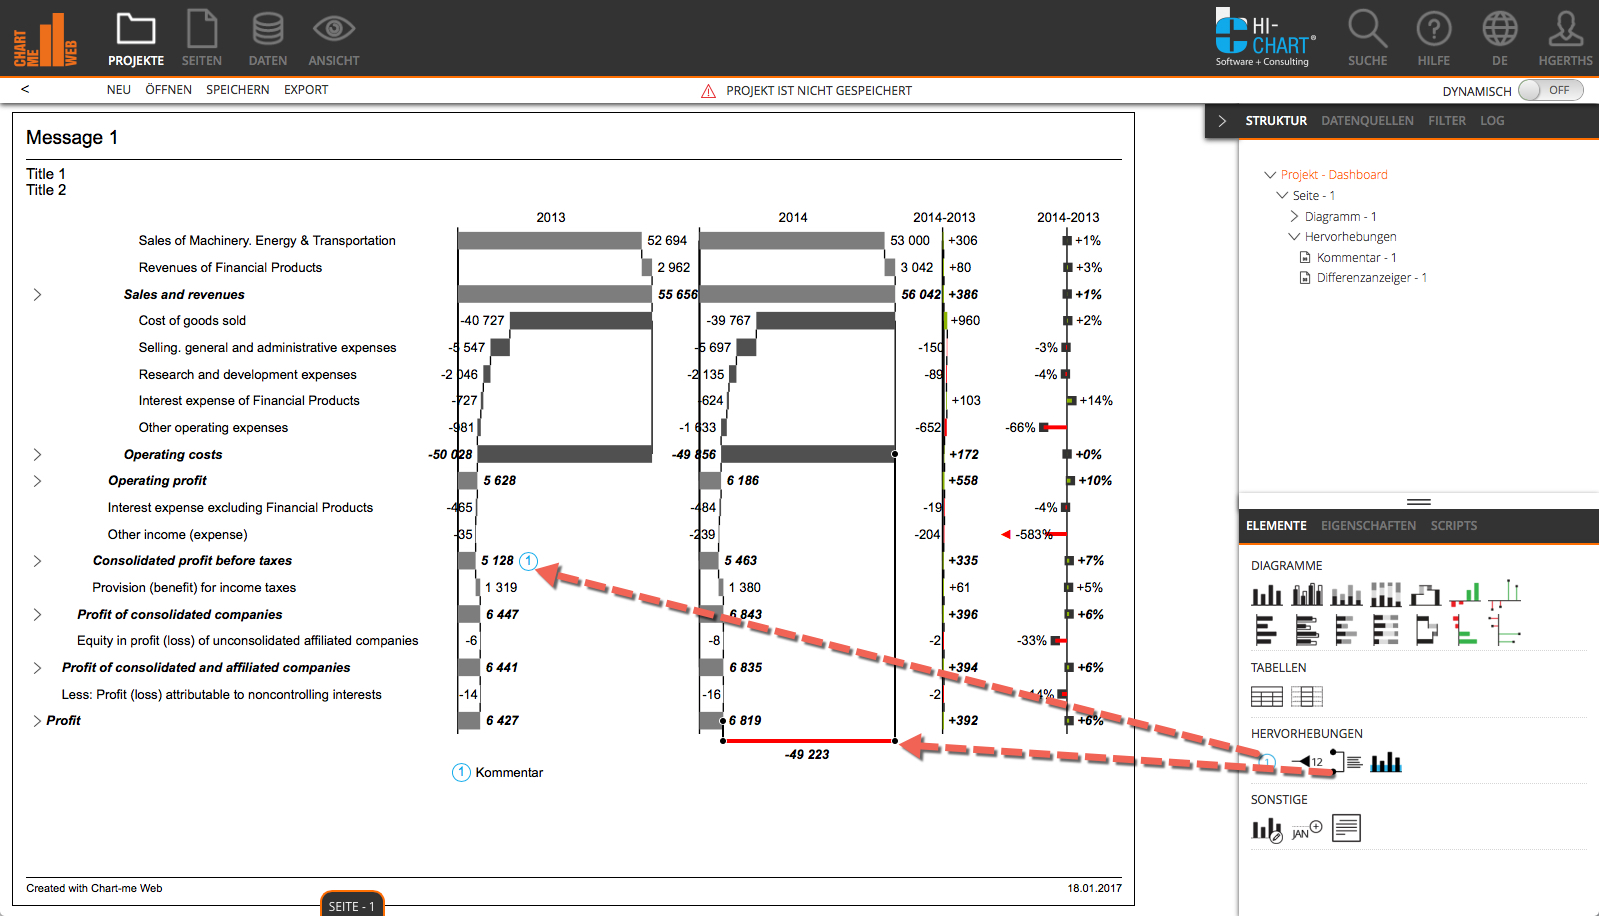
The uploaded Excel data files are stored in a project directory on the server. The data files can also be exchanged on the server and the corresponding project can be updated.
Interfaces to external databases are also available
hi-chart projects can be exported as multi-page PDF files or as images (jpg, png).
hi-chart projects are stored in the application database or as a file (.chartme).
TRY OUT HI-CHART NOW FOR FREE!
With no obligation
 Twitter
 Xing
Xing YouTube