different possibilities
of Interactivity in
hi-chart Live Examples

Management reports and statistics

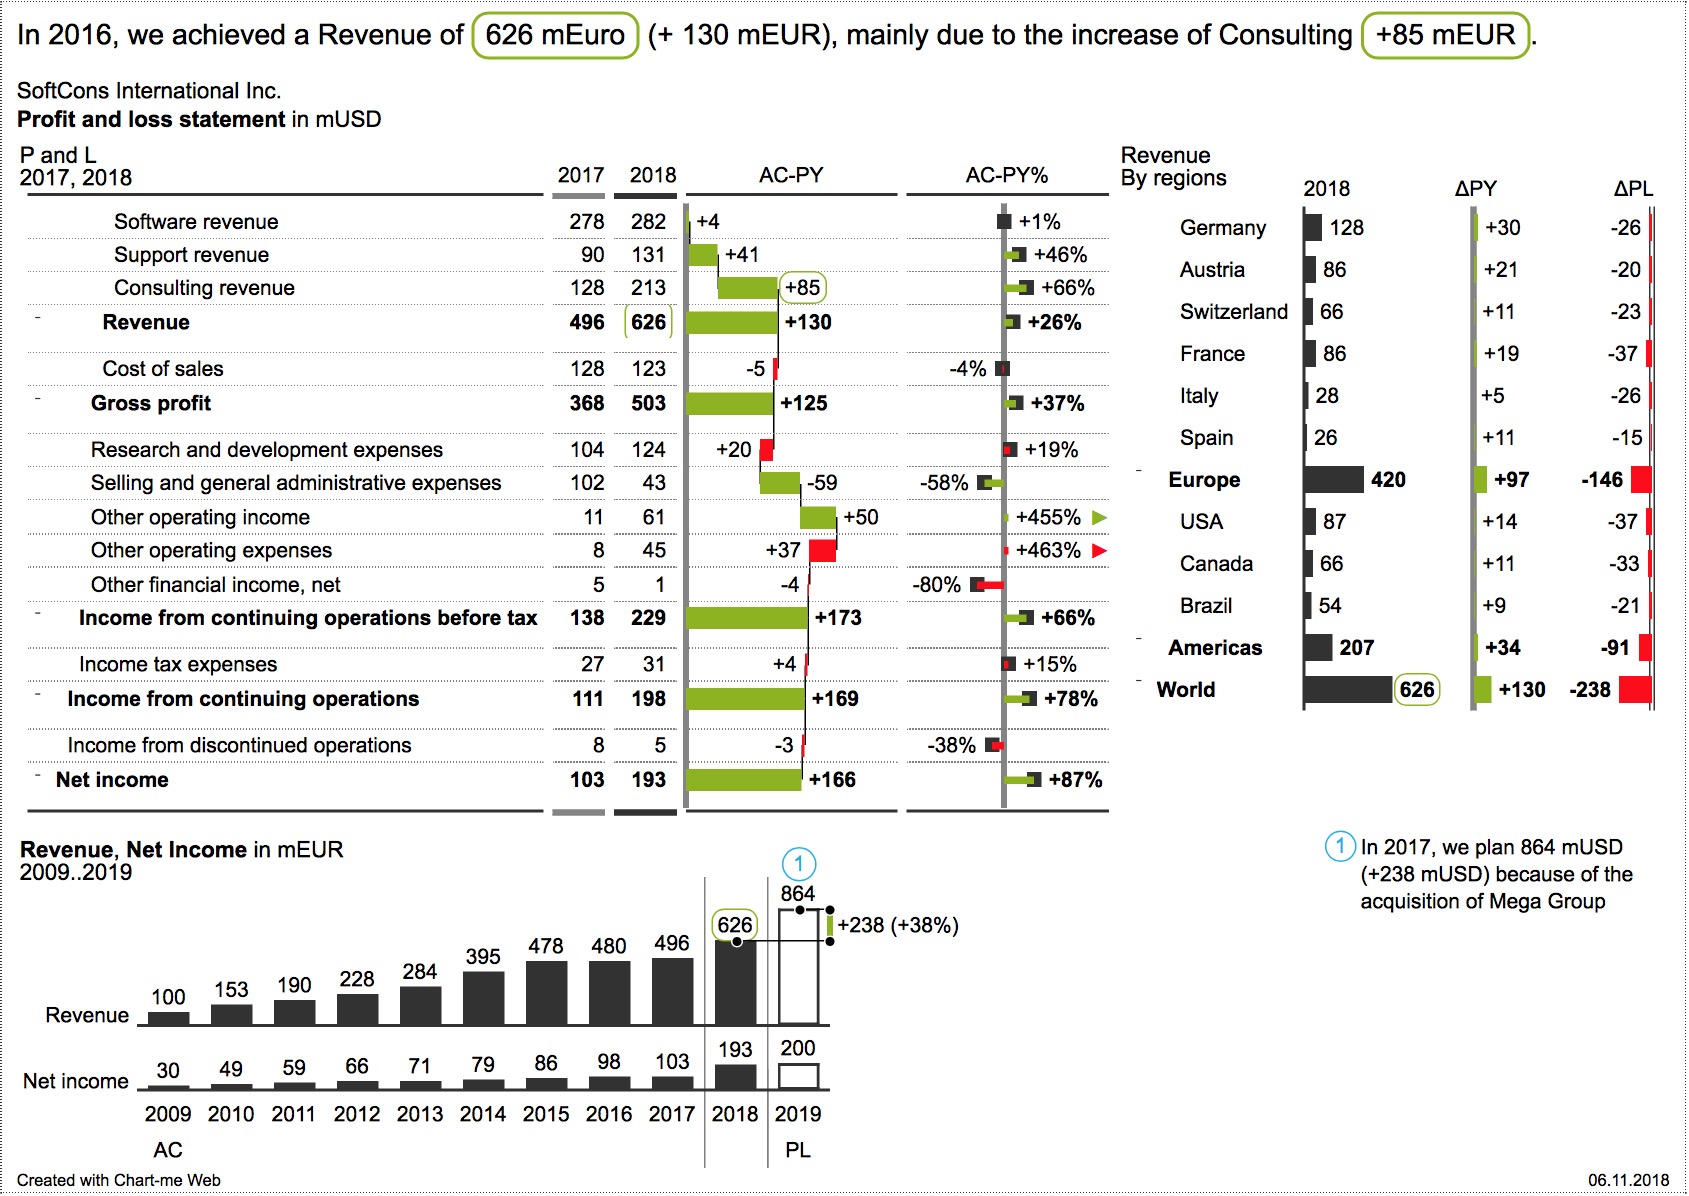
With hi-chart, static management reports and statistics can be created, edited and published in various media formats, such as images, PDF, HTML and Excel. These can be distributed with e-mails and web pages or processed with software products such as Word and PowerPoint.

Dynamic Dashboards

Because of the required interactivity, dynamic dashboards are usually only distributed in HTML format or in Excel. With hi-chart they can be embedded for the user into existing websites. Users can pre-define user interactions, such as browsing, filtering, or folding-out hierarchies.

Data Links

Data links can be created and updated to Excel files and external data sources such as TM/1, SAP BW and ODBC. The charts and tables shown here are a dynamic link to the original project.

interactivity

For a dynamic user experience, drilldowns in hierarchies are possible. With hi-chart, click-events can be defined at different levels and almost any interactive response can be programmed with JavaScript.

Table Template (IBCS 04)

Static Table Template
  • with semantic column headers,
  • hierarchical row structure and
  • integrated charts with absolute and percentage variances.

  • The hierarchy nodes can be expanded and collapsed using the +/- characters.
  • In the hi-chart Designer interface, the data can be easily updated by dragging an Excel file over the chart or via one of the data interfaces (TM/1, SAP BW or ODBC).

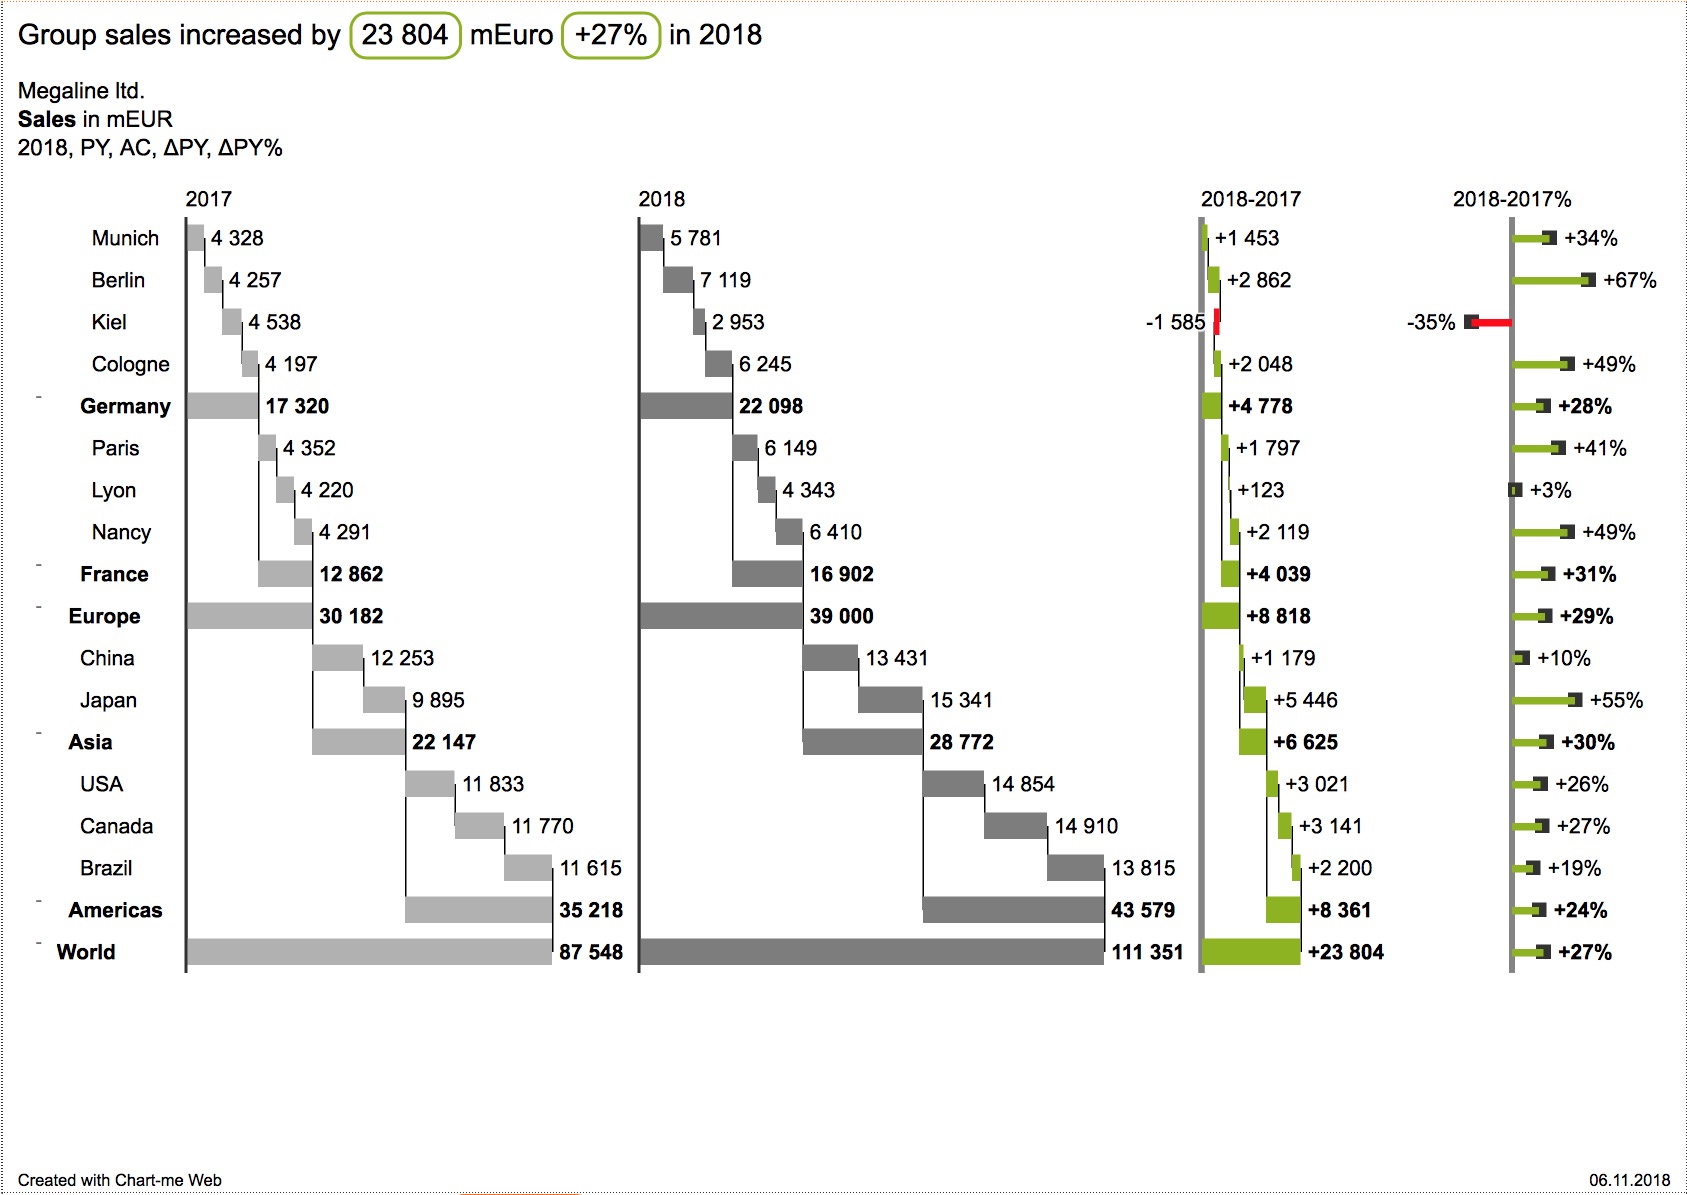
Waterfall

with detail view via clickable areas
  • The waterfalls 2017 and 2018 can be clicked to open a detail view.
  • In the detail view, the filter button at the bottom can be used to filter countries.
  • You can use the “Zurück zur Übersicht” button or the the pager at the bottom to go back to the overview page.

TRY OUT HI-CHART NOW FOR FREE!

With no obligation