Ressources to the book “Designing business charts with Excel based on the standards of Hichert@SUCCESS”
Excel colors
A separate section should be devoted to this subject, as colors are an important aspect of HICHERT®SUCCESS: Colors should only then be used when they convey “meaning.” It is not enough to merely “look nice,” since readers and audiences are not sure whether these colors actually mean anything (i.e., contain information) or are just intended to look nice (i.e., decoration).
This presupposes that we are dealing with “professional” endeavors and not brochures or advertising material, as different rules apply here. If we look at maps, music notes, and technical drawings, we see that colors are not used here simply for appearances – instead everything has meaning, a consistent notation concept applies to each (please also see SUCCESS Rule UNIFY).
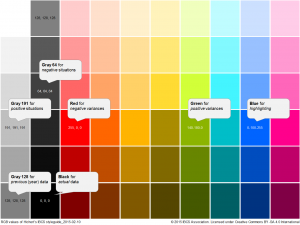
The following colors are particularly significant for compliance wit the International Business Communication Standards (suggested RGB values from Hichert’s IBCS styleguide are given for each color):
+Black for actual data: 0, 0, 0
+Gray for previous period data (in general previous year): 128, 128, 128
+Gray for positive situations: 191, 191, 191
+Gray for negative situations: 64, 64, 64
+Red for negative variances : 255, 0, 0
+Green for positive variances: 140, 180, 0
+Blue for highlighting: 0, 100, 255
The remaining colors in the following color scale included in Excel 2010 can be used according to individual requirements; these usually include distinctions or enhancements.
Click here to download an xml-file defining the colors for Office 2010.
Please note: the sequence of the six rows of color on the right do not agree with the color concept in Office 2010. The fourth row of colors corresponds to the “theme colors and were inserted here into the palette.
(Both hyperlink colors were omitted as they cannot be selected.)


 Twitter
 Xing
Xing YouTube