Basic features
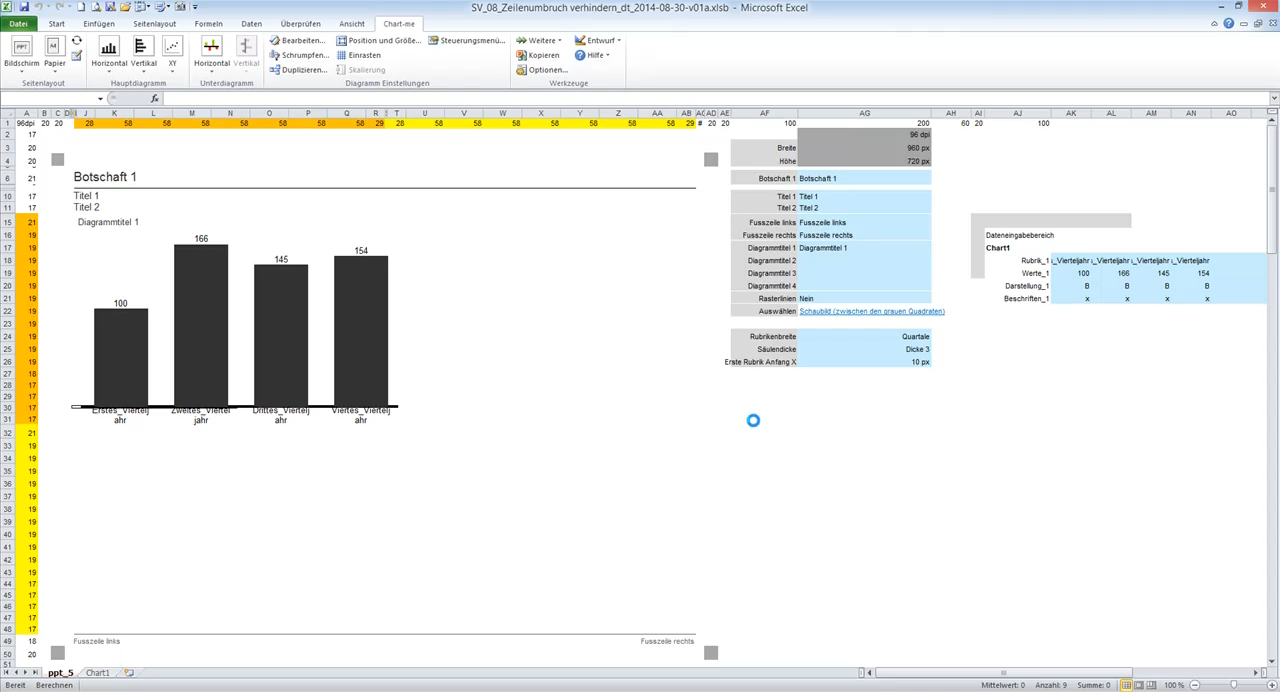
1. Chart-me XLS Getting Started
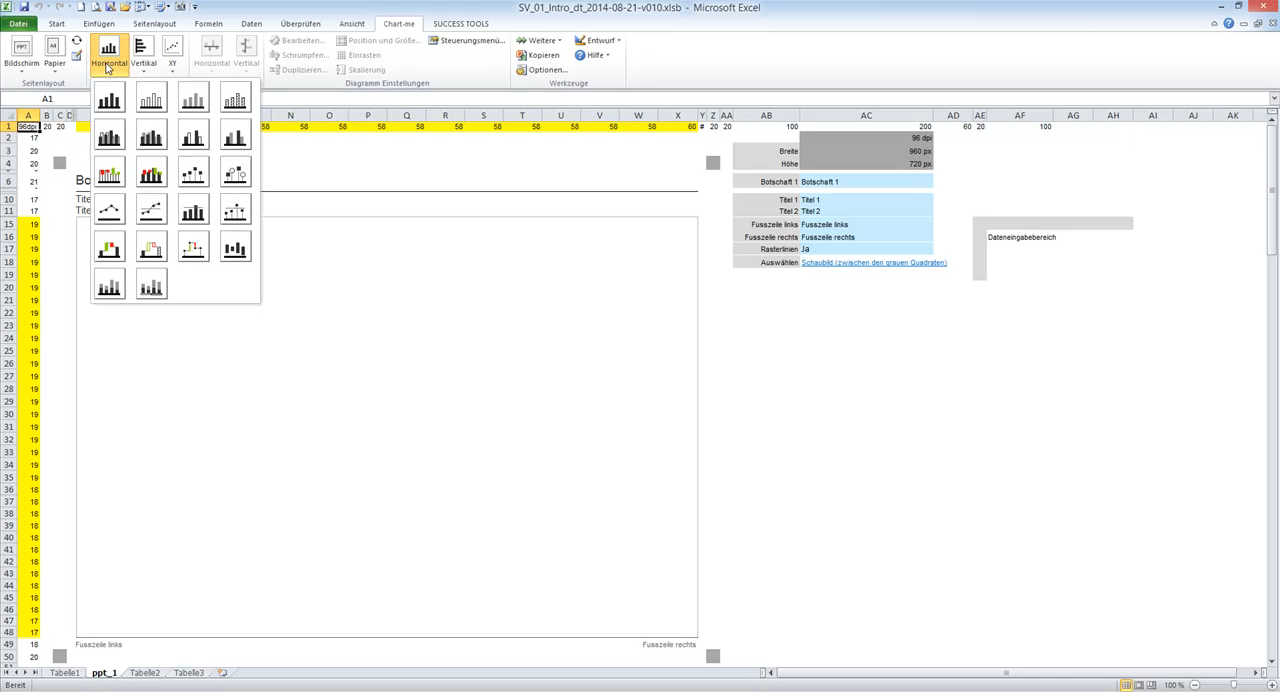
Select grid
Add chart and sub charts
2. Dynamic grid
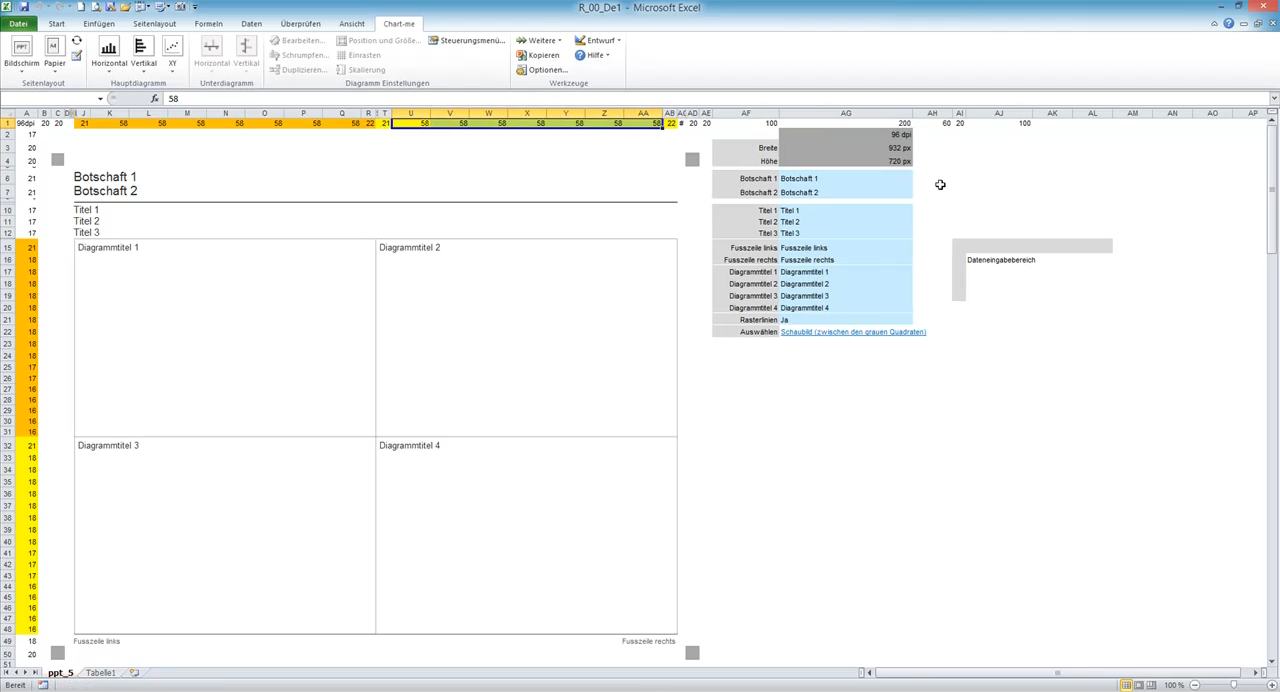
Edit row and column widths comfortable and pixel accurate
3. Control widths
Control column widths and column thickness
4. Change font size
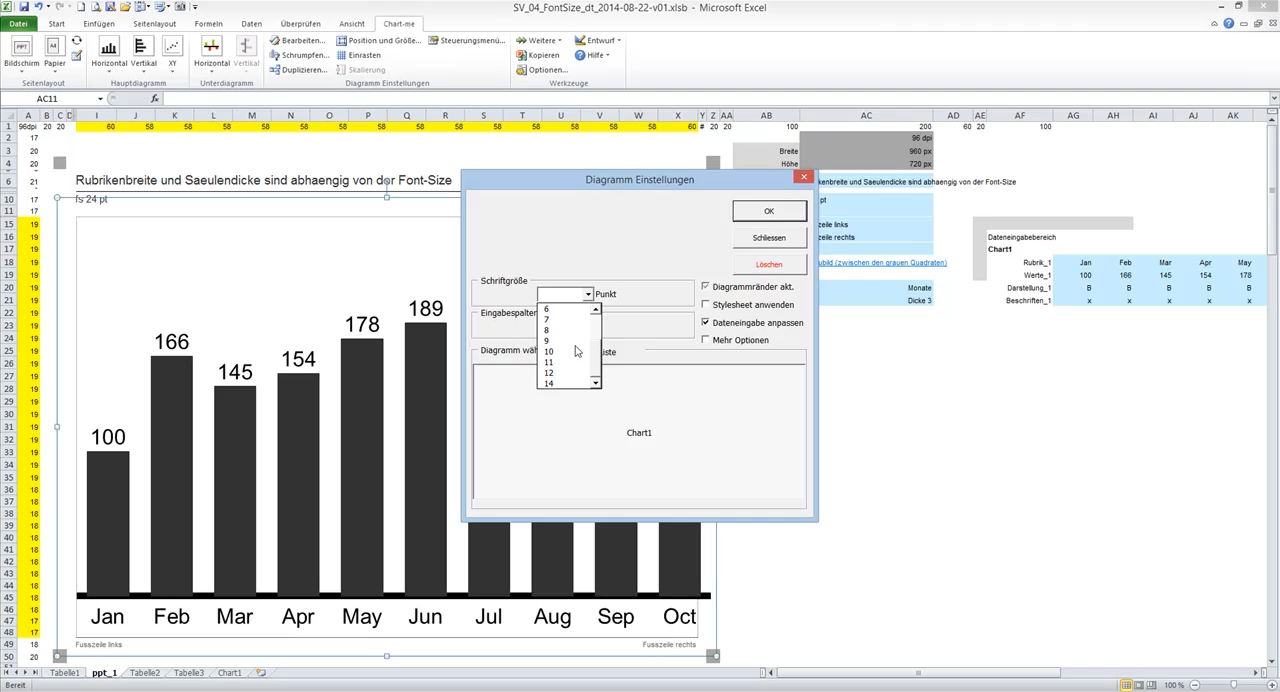
Changing the font size also changes all dependent sizes, such as column widths, font spacing, and point symbol sizes, proportionally.
5.1 Control scaling
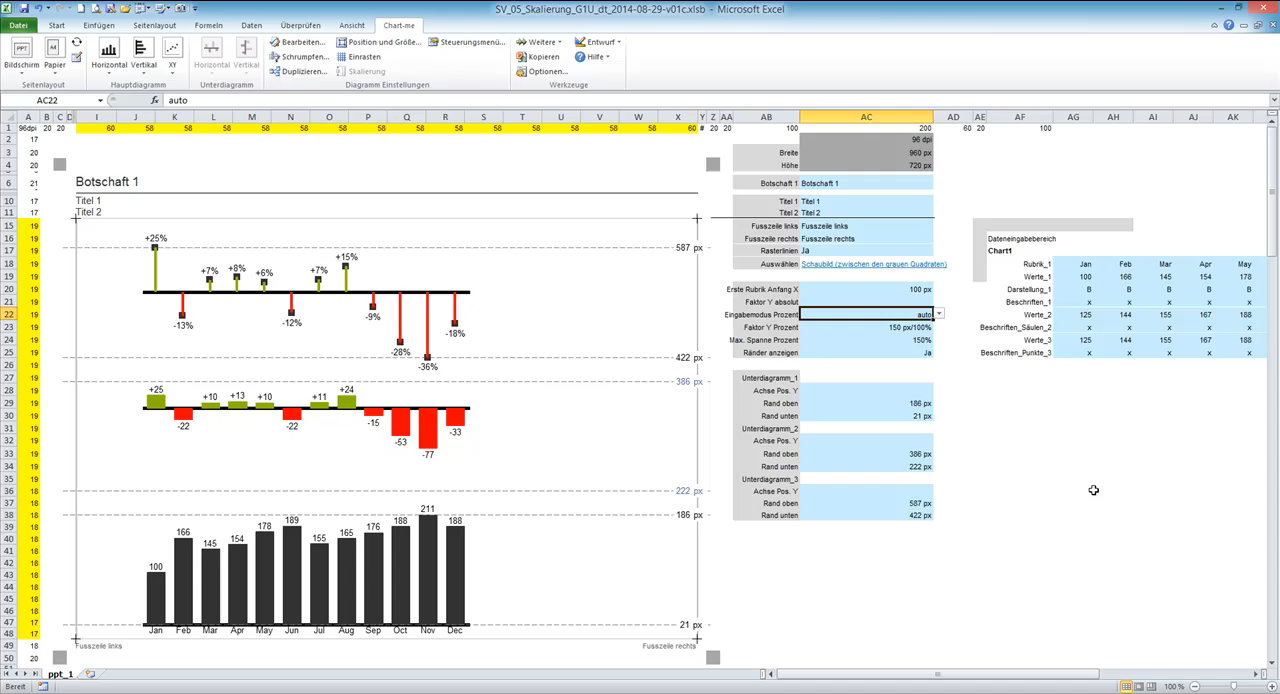
Area division of sub charts, scaling factor and axis positions
5.2 Control scaling
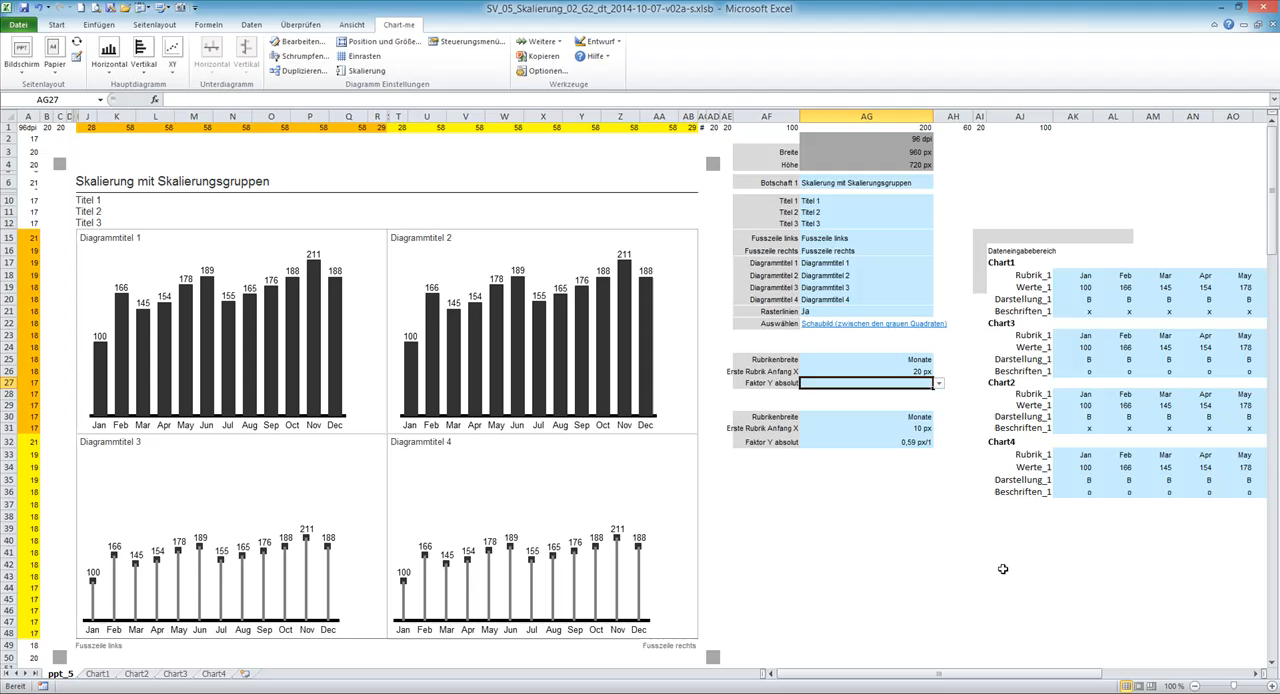
Scale multiple charts synchronously
6.1 Control scenario display
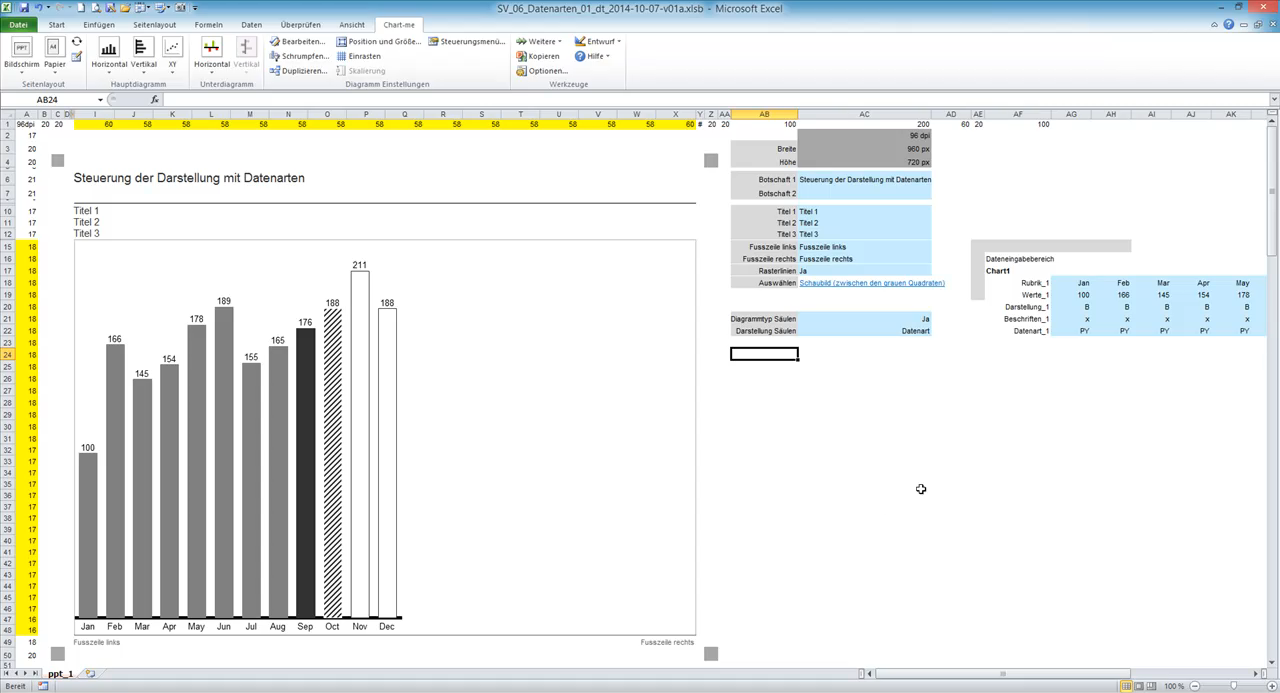
Control of the representation of the data series with different scenarios
6.2 Control scenario display
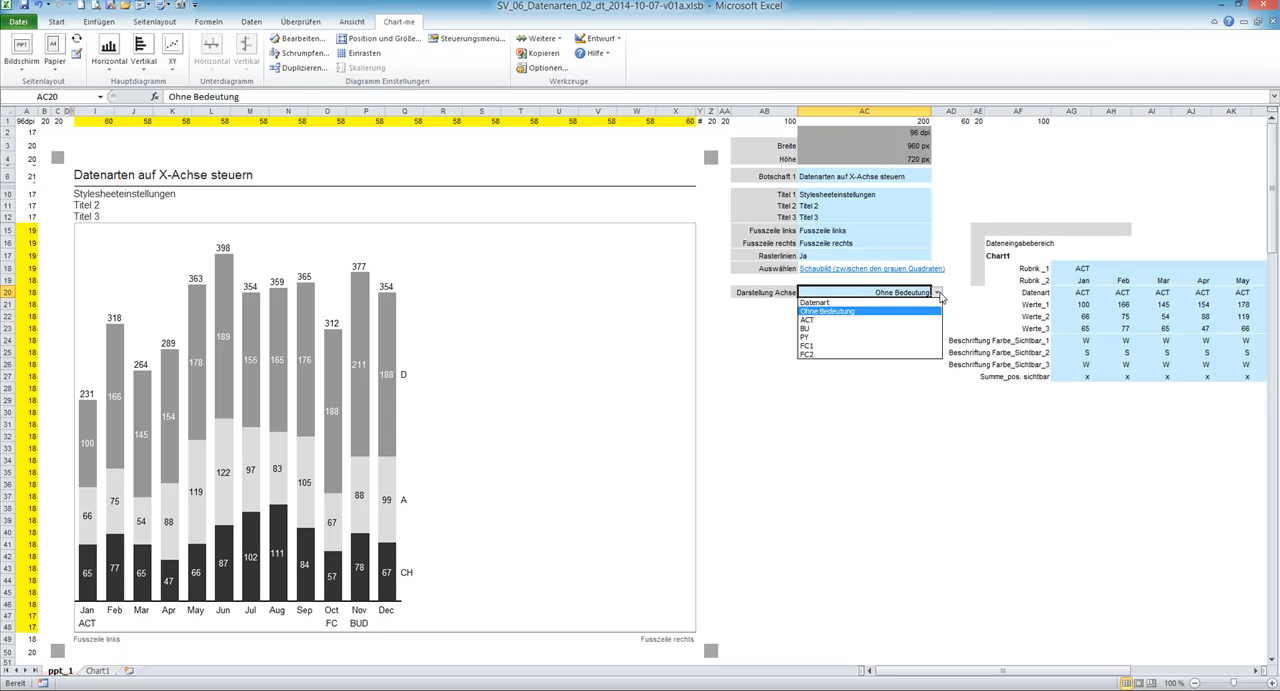
Control the representation of the chart axis with different scenarios
7. Add a value labeling
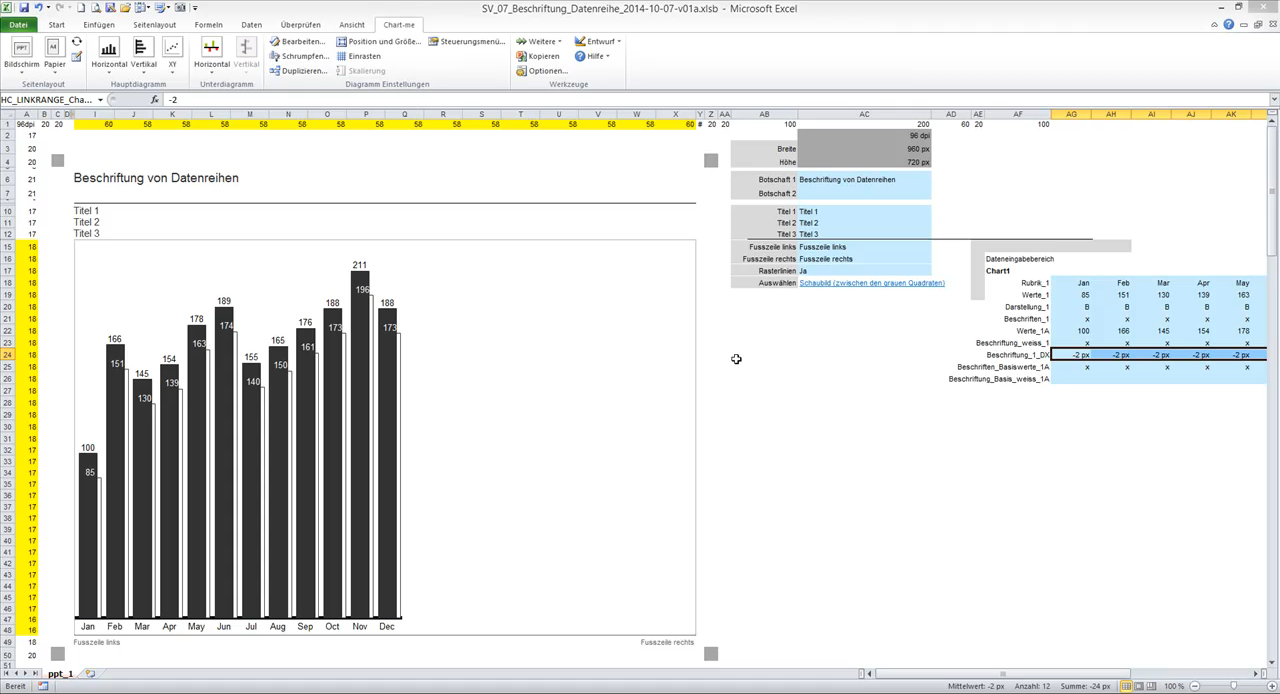
Add and control a value labeling
9. X axis labeling
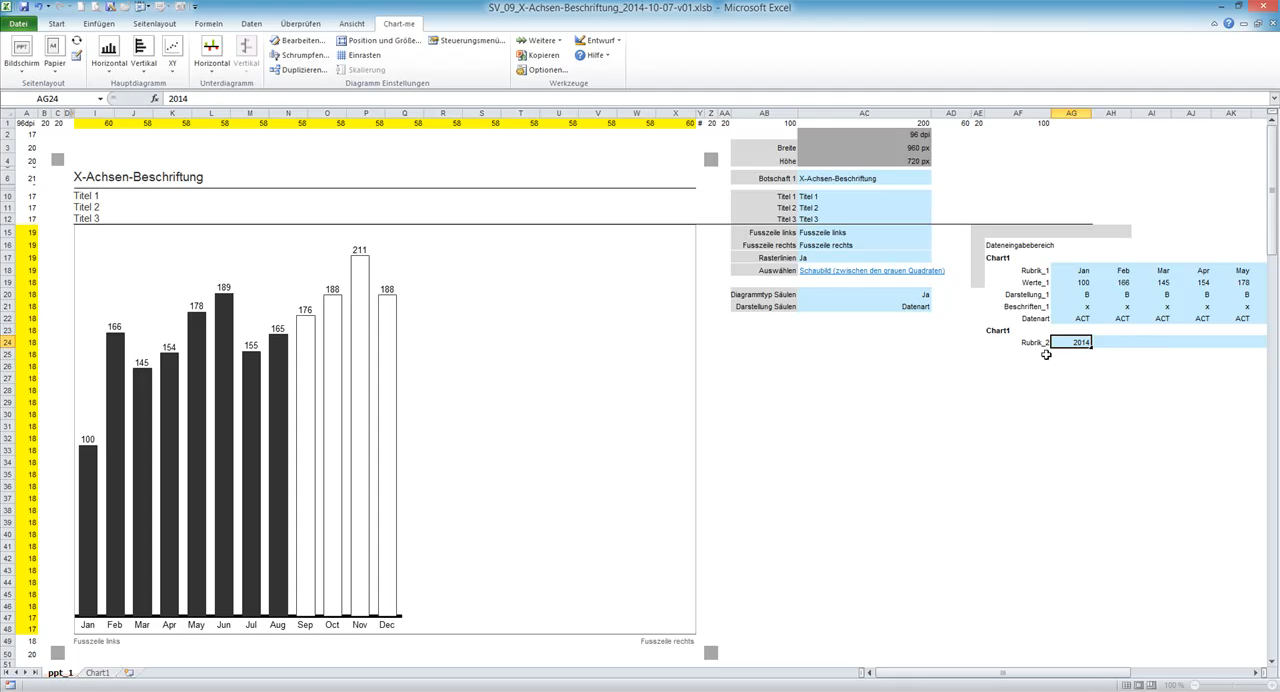
Insert additional rows and automatically determine axis position
10. Chart size
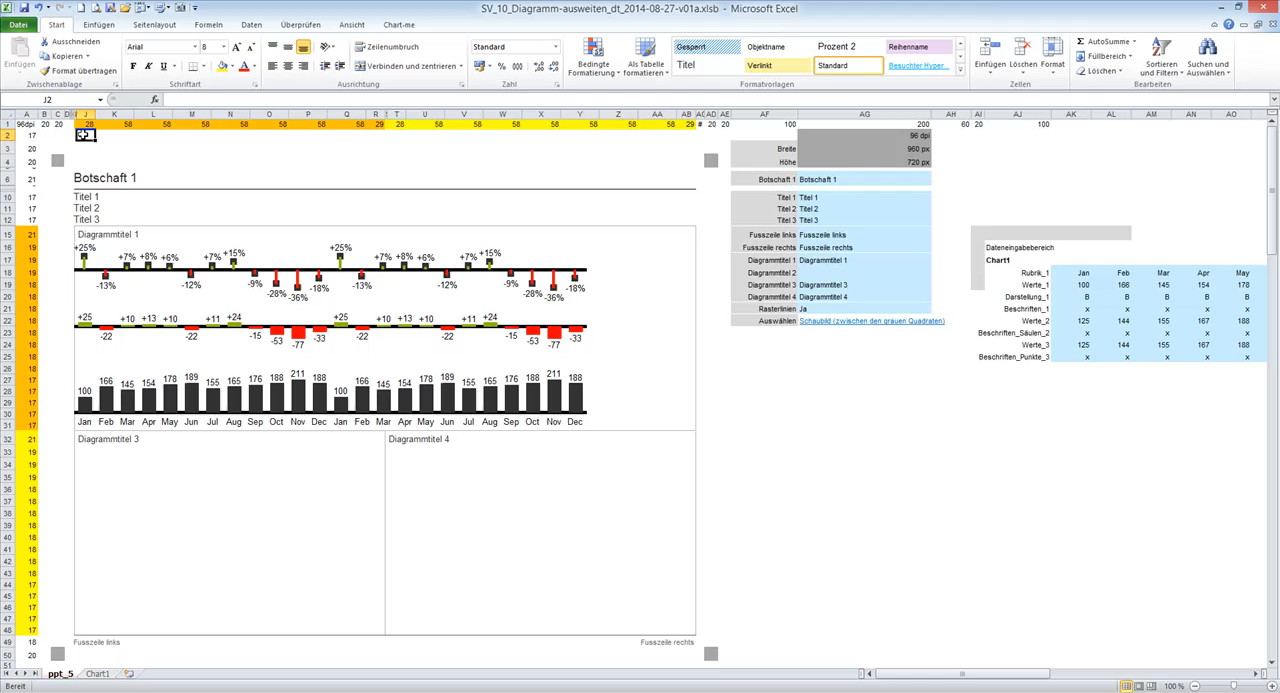
Extend the size of the chart to multiple grid cells
11. Waterfall chart
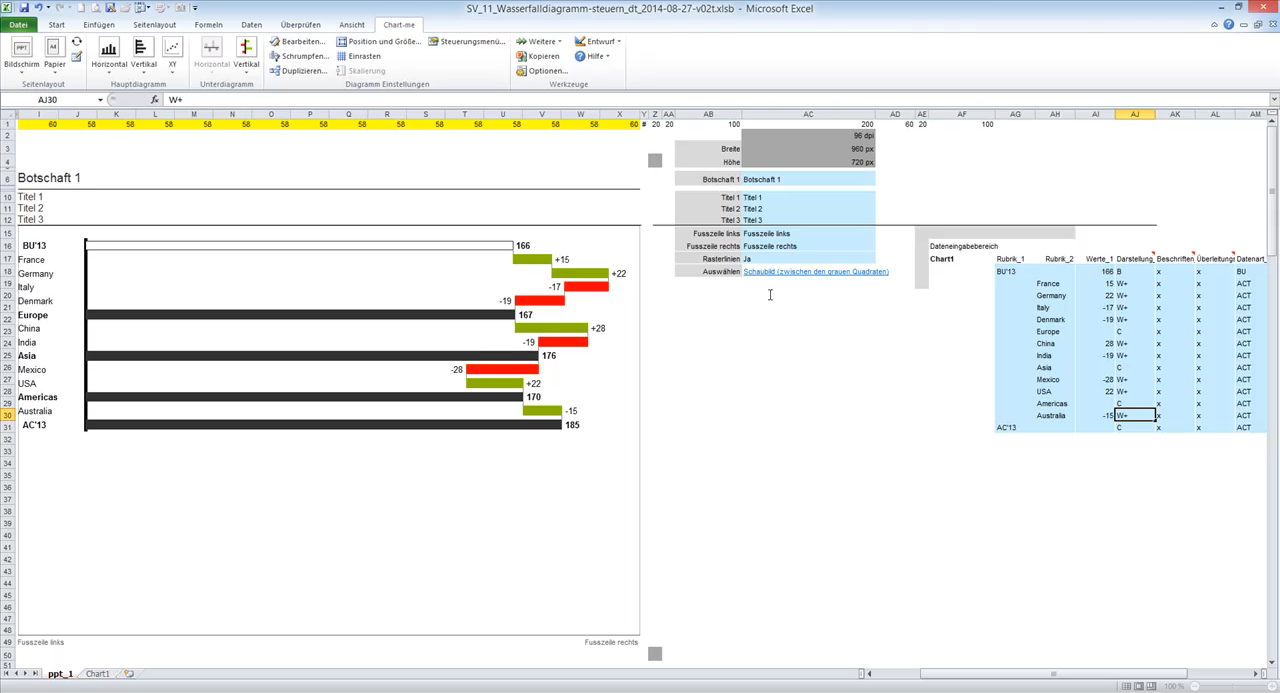
Control waterfall chart with W+, W- and C
15. Link to PowerPoint
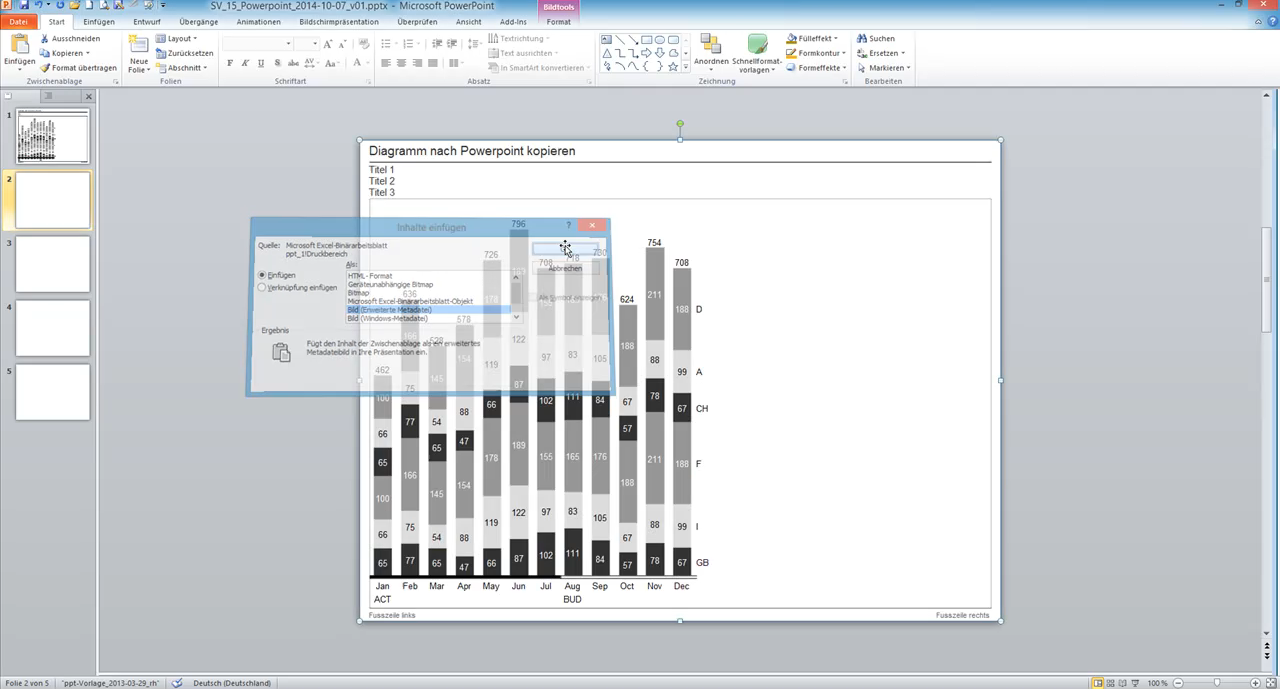
Link an Excel page to PowerPoint
12. Variances
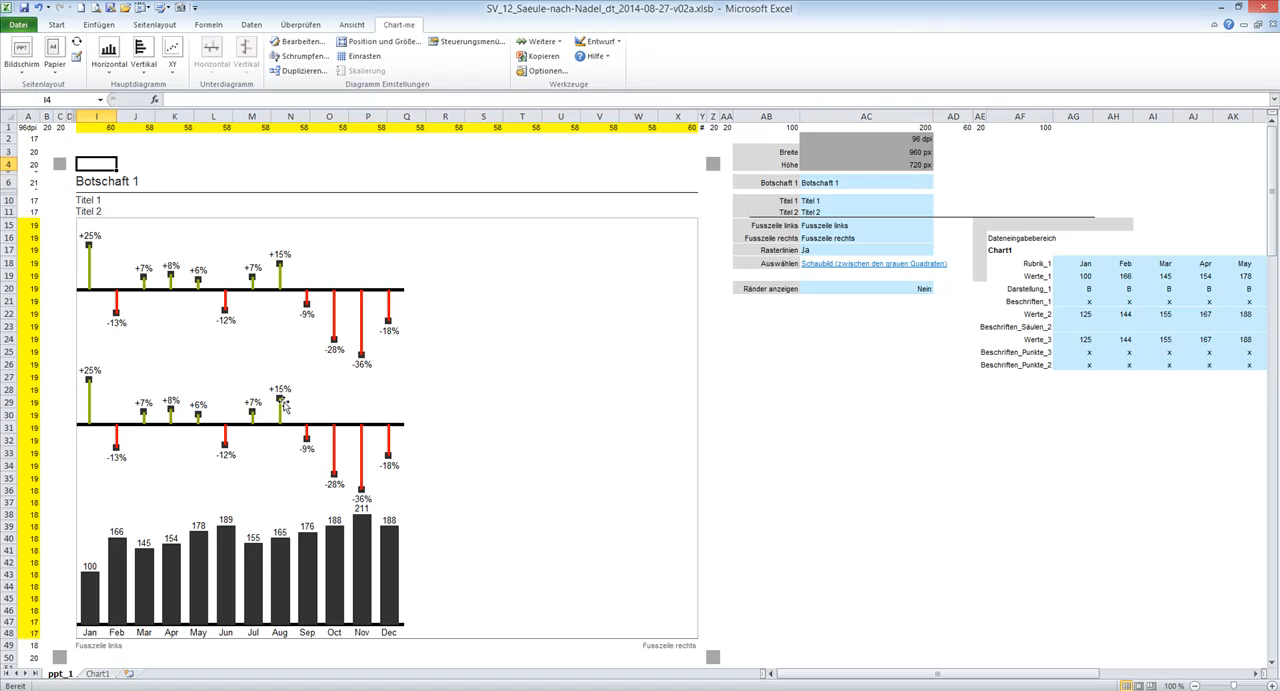
Change variances between column and needle charts
14. Additional data series
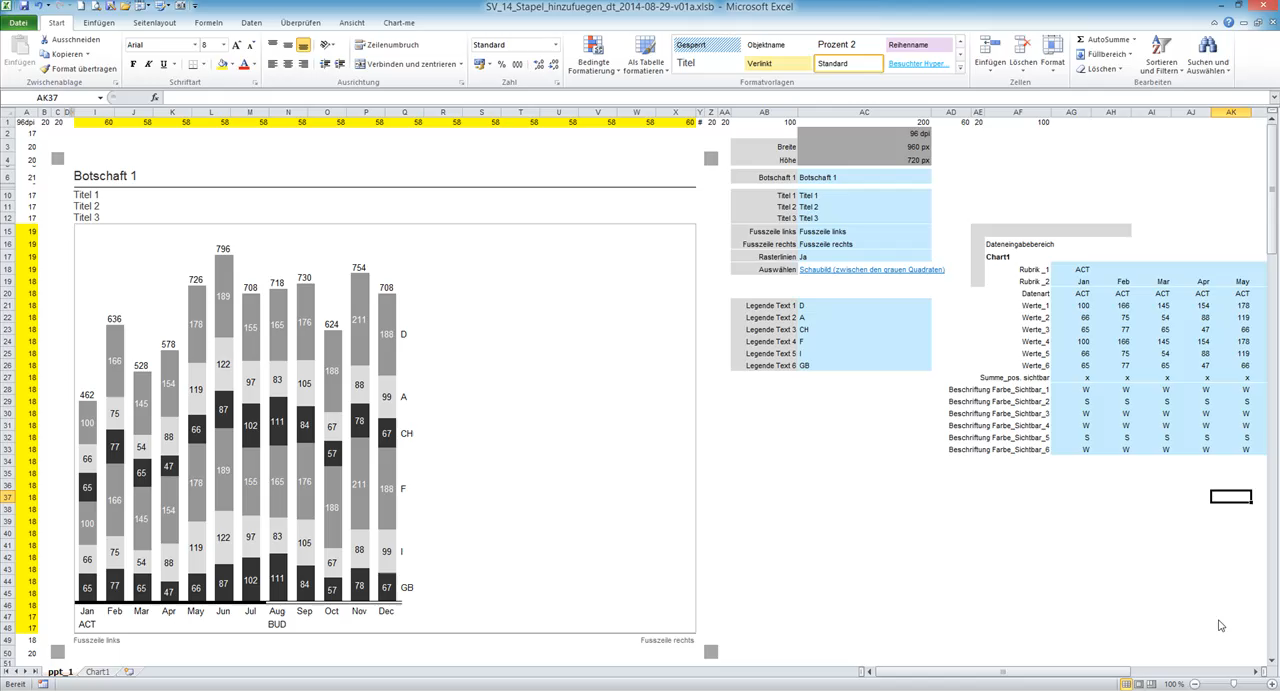
Add additional series to stacked charts
Advanced features
8. Line breaks
Avoid line breaks in labels
16. Multiple charts
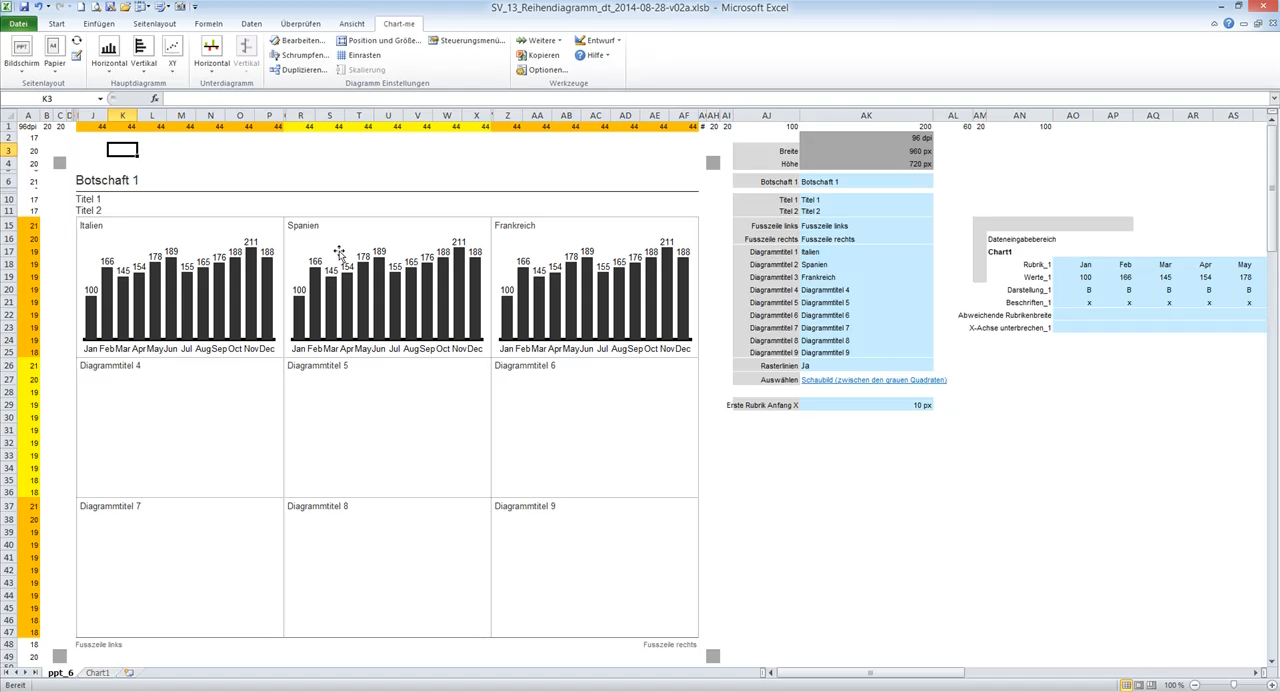
Show multiple charts in one object with series charts
FAQ
Which Excel versions are supported by Chart-me XLS?
Excel 2007, 2010 und 2013 and 2016.
Where can I make detailed settings on the individual charts?
Open the control menu in the Chart-me XLS menu and select the desired charts above. Below, the detailed settings can be made.
The settings are in cells in the hidden chart sheets (Chart1, Chart2, …). These chart sheets do not usually have to be edited directly, but can be displayed under the Chart-me XLS menu item More.
How do I find myself in the chart sheet cope more easily?
There are links at the left of the empty chart area that allow you to navigate to various settings topics.
In the variance chart, the percent deltas are 0 or NULL, but green and red dots are shown. Can I suppress this?
Yes, by setting the point data type in the Control menu under Chart2 or Chart3 to Data Type and entering a data type in the input area under Data type_points_2 or _3 where you want to display the points.
In the chart area, dotted lines and pixel data are displayed. Why?
These are help lines that represent the space division between the main chart and the sub charts. These can be switched on and off in the control menu on the General tab under Display marks.
Can I set the scaling for a sub chart separately?
Within a chart, all values have the same scale. One exception: Percent variances have their own scaling.
How can I control the scaling of percent variances?
There are three input modes for scaling percent variances:
- Auto: The optimal scaling is determined automatically.
- Max. span perc.: A maximum value range from which the scaling is calculated can be entered in Max. span perc.
- Factor Y perc.: A fixed scaling factor can be entered in Factor Y perc.
How can I label a sub chart next to the X axis?
In the control menu under, X-axis labeling can be entered on the right and left of each X axis.
Furthermore, such texts can also be made with the input Free texts in the diagram sheet.
A maximum of 50 free texts can be entered here.
There are the following columns:
Text: The text to be displayed
X: The X position of the text insertion point measured in columns.
X (px): An additional X position in pixels. If this specification is made in addition to the X input, the pixel input is added to the categories position. If the X input is empty, the label is moved from the left edge of the chart by the pixel input X (px).
Y: The Y position of the text insertion point measured in the scale of the input values.
Y (px): An additional Y position in pixels. If this specification is made in addition to the Y input, the pixel input is added to the value position. If the Y input is empty, the label is moved from the lower chart edge by the pixel input Y (px).
Alignment: The horizontal alignment of the text to the insertion point.
Possible are:
L = Left
R = Right
C = Centered
Chart: Specifies the sub chart in which the label is to be placed.
1 = main chart
2 = variance chart (chart 2)
3 = variance chart (chart 3)
Bold: x for bold font, blank for normal font
How can I add references to footnote descriptions in the chart?
This can be done with a footnote reference (numbering in a circle symbol). These are positioned in the chart at the location to be described and are described in more detail in the footnote. This can be done with the entry of free points in the chart control sheet.
The chart control sheets can be made visible in the menu under Chart-me – Tools – Other.
A maximum of 50 points can be entered here.
Text: The number to appear as numbering in the circle symbol. Only valid for symbol = 1 (see below).
Visible
X: The X position of the text point measured in categories.
Y: The Y position of the text point measured in the scale of the input values.
Y (px): An additional Y position in pixels. If this specification is made in addition to the Y input, the pixel input is added to the categories position. If the Y input is empty, the label is moved from the lower chart edge by the pixel input Y (px).
Chart: Specifies the sub chart in which the label is to be placed.
1 = main chart
2 = variance chart (chart 2)
3 = variance chart (chart 3)
Symbol: Specifies the point symbol.
1 = circle with input text in the middle (= footnote reference)
2 = Arrow point to the left
3 = Arrow top
4 = Arrow point to the right
5 = Arrowhead down
At 2..5 the text is ignored.
I have inserted multiple charts on a page. How can I get these automatically to have the same scaling?
Scaling groups can be defined in the menu under Chart-me XLS – Settings – Scaling. All charts, which are in common scaling groups, are scaled in the same way as the absolute values and the percent variances.
The "common scaling" refers to all charts and sub-charts, that is, e.g. also with percent and bars?
Yes, the percentage variances are then also scaled commonly.
Where can I set round points instead of small rectangles in point charts?
Point symbols can be set via the data type in the control menu. This can be done under Chart 1, Chart 2 and Chart 3. A data type can be set under Display points. The data type entry can be selected. A separate data type can then be entered for each section in the input area.
Can I transfer all parameters from one chart to another?
Ja, die Einstellungen eines Diagramms auf ein anderes geht mit der Chart-me Funktion Einstellungen übertragen unter Chart-me – Weitere.
Yes, the settings of one chart to another are transferred using the Chart-me XLS function Clone settings under Chart-me – More.
How can I delete a chart?
With the Chart-me XLS function Edit… one or more charts can be selected and with Delete the chart objects and the corresponding chart control sheets can be deleted.
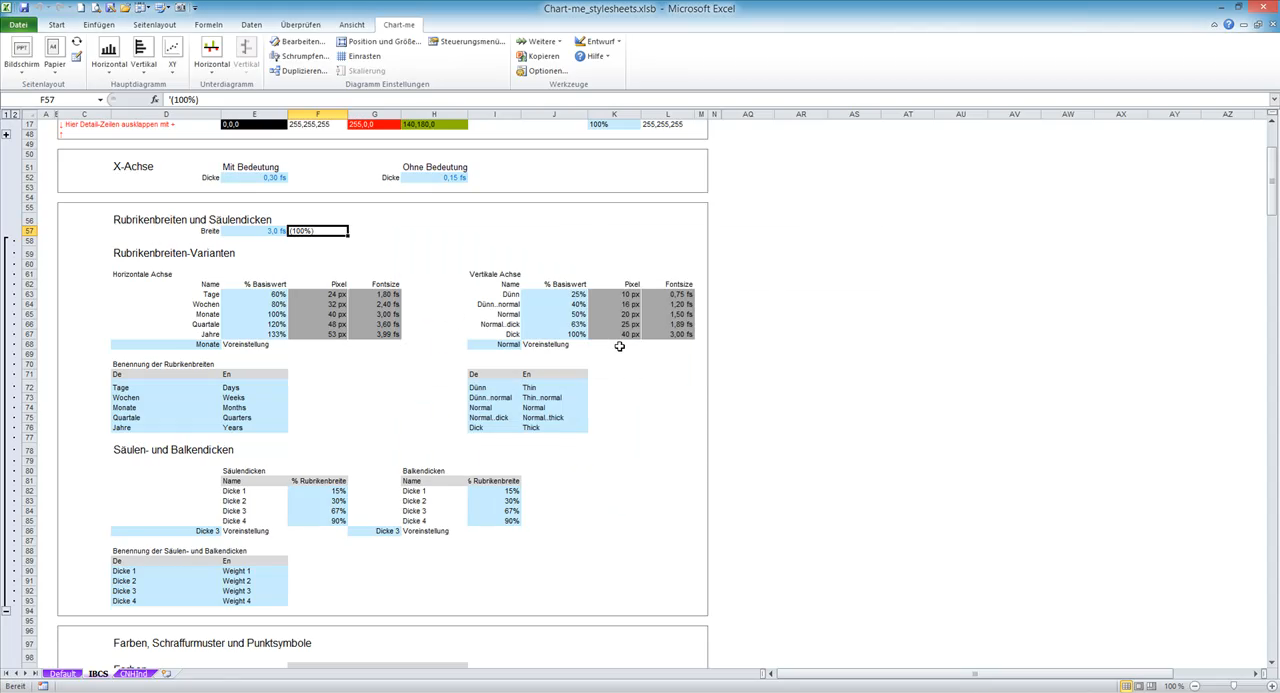
Where can I set the point size of the percent variances?
This can be set in the Chart-me XLS Stylesheet. The stylesheet can be opened in Chart-me – Options using the […] button next to Style. One of the supplied sheets Default or IBCS can be duplicated to create your own styles. A style created in this way can be activated in the Options dialog for Style.
Already created charts can be changed to a later created or edited style. For this purpose, the desired charts are selected in the Chart-me XLS dialog Edit…, the option Apply Stylesheet is selected and then confirmed with OK.
Can I change a chart to for example double height if it is to display larger values than the other charts?
Yes, you can set a chart on any pixel size. To do this, open the Chart-me XLS Move and size function. Here, a chart is selected in the first dialog, and either a prepared area can be clicked in the grid in the following dialog step, or either the pixel size can be entered manually by means of multiple options or an arbitrary cell area can be entered for the positioning and size specification in the cell area.
Can I combine stacked bars with PY and BUDGET variances?
This is done by superimposing two charts as follows:
Insert a stacked chart at a position on a grid, and then insert an unstacked chart in the same place. The desired variance charts are added to the unstacked chart, and then the main chart is switched off (Chart_1 -> Visible -> No).
Can I label the stacked bars?
Yes, in the data input area you can enter B for black and W for white labeling under Label_Color_Visible.
Where can I set an axis to hollow?
The data type is adjusted in the control menu for X axis display. With the IBCS default style, data type BU shows hollow columns, bars, and axes.
Can I integrate a single diagram with OLE into a Word document? Do I have to make this as a bitmap? How do I make a Word report?
This is basically the same as with PowerPoint with linking best. Copy the cell range in Excel and paste it into PowerPoint or Word with Paste Special -> Paste link -> As an Excel worksheet object. Then set the size of the inserted object to 100%.
How can I hide zeros in labeling?
This can be controlled in the control menu under Number format B, C, S, Number format W +, W-, Number format deviations base values, Number format deviations percent values or Number format lines with the setting Hide null values.
System requirements and installation
Download and installation
After purchasing or downloading the test version, you can install the Excel addIn Chart-me XLS immediately – simply by double-clicking on the installation or setup file. After installation, Chart-me XLS appears as a new menu in Excel 2007/2010/2013/2016. The user guide, tutorials, and other information on how to use Chart-me XLS can be found in the support section of this website.
System requirements
| Operating systems: | MS Windows (Vista, 7, 8, 10) |
| MS Office: | Möglich: MS Excel 2007, 2010, 2013, 2016 Empfohlen: MS Excel 2010 |
| Disk space | At least: 100 MB free for installation files and projects |
| RAM: | Recommended: 4 GB or more |
| Graphic resolution: | Recommended: 1280 x 960 Pixel or higher |
| CPU: | Recommended: Dual-Core 1,5 GHz or higher |
hi-chart
Test now!
NEWSLETTER REGISTRATION
[hubspot type=form portal=19954785 id=18817a4c-075b-44a8-9f66-c4d595738f03]
 Twitter
 Xing
Xing YouTube